
Introduction
AI systems miss sustainability disclosures when the information is hard to reach, hard to extract or missing its context, even if the company has published it. The most common causes are complex PDFs, vague statements, inconsistent terms, metrics without years or units, scattered documents, poorly structured tables and web pages that crawlers cannot access. Each can be fixed with changes to how disclosures are published.
This matters because more of the people assessing your company now use automated tools. ESG data providers use technology to collect and process disclosures. Analysts use AI assistants to summarise reports. Investors increasingly ask ChatGPT, Perplexity or Google's AI Overviews about a company before they open its website.
For rating agencies, what is publicly findable can affect scores directly. In S&P Global's Corporate Sustainability Assessment, around 70% of questions require publicly available data to score any points. Companies that do not take part are assessed by analysts using public information alone.
The seven problems covered in this article:
- Sustainability information buried in complex PDFs
- Vague statements without supporting evidence
- Inconsistent ESG terminology across documents
- Missing reporting years, units or organisational boundaries
- Information scattered across multiple documents
- Poorly structured ESG data tables
- Website content that automated systems cannot access
We also tested the public sustainability pages and reports of five highly rated companies to show what these problems look like in practice.
Why do AI systems miss sustainability disclosures?
An automated system has to clear four separate steps before a disclosure counts, and it can fail at any of them:
- Retrieval: can the system reach and locate the page or document? Blocked crawlers, broken links and content that only appears after JavaScript runs fail here.
- Extraction: can it pull out the right text, number or policy? Scanned pages, charts and complex tables fail here.
- Interpretation: does it understand what the figure means, including the year, unit, scope and boundary?
- Evidence evaluation: does the extracted information meet the specific criterion being assessed, such as a policy that names who is responsible and when it was approved?
Some problems are technical and some are about the methodology of frameworks. Some rating agencies rely heavily on human analysts, some use more automation. Most combine the two. Academic work on LLM-based ESG extraction has reported accuracy of around 77% for data extraction with GPT-4, and noted that charts and images were not processed. Even good systems lose information along the way.
7 common sustainability disclosure problems that AI systems can miss
1. Sustainability information buried in complex PDFs
Most sustainability reports are designed PDFs of 100 to 340 pages. Multi-column layouts, text inside images, charts and footnotes all make extraction harder. In our tests, numeric footnote markers merged into the figures they annotate: a target "by 2030" with footnotes 3 and 4 was extracted as "by 20303,4". Untagged PDFs also lose their heading and table structure, which W3C guidance on PDF accessibility says should be carried in the document's tag tree.
Fix: publish tagged, searchable PDFs with a meaningful document title, use letters or symbols for footnotes next to numbers, and put key data in HTML as well.
2. Vague sustainability statements without supporting evidence
Broad commitments give a system nothing concrete to extract. S&P Global states that policies "without clear measures on how such commitments are enforced" lack the robustness to score well.
| Before | After |
|---|---|
| "We are committed to respecting human rights throughout our value chain." | "Our Human Rights Policy (approved by the Board, March 2025) applies to all employees and Tier 1 suppliers. The Chief Sustainability Officer is accountable for it. In 2025 we completed human rights due diligence at 42 high-risk sites and remediated 11 findings." |
Illustrative example; figures are invented.
3. Inconsistent ESG terminology across documents
When one report says "GHG emissions", the data book says "carbon footprint" and the website says "CO2 output", a system may treat them as three different metrics or miss the link entirely.
Fix: use one name per metric everywhere, define abbreviations on first use, and reference the framework the metric follows, such as GRI 305-1 or ESRS E1-6.
4. Missing reporting years, units or organisational boundaries
A number without its context cannot be interpreted correctly or compared.
| Before | After |
|---|---|
| "We have significantly reduced our emissions." | "Scope 1 and 2 (market-based) emissions were 137,779 tCO2e in calendar year 2025, down 44% from the 2018 base year (246,383 tCO2e). Boundary: all 31 manufacturing plants worldwide." |
The "after" example is based on how CNH reports its emissions, which we cover below.
5. Sustainability information scattered across multiple documents
Policies sit on one page, targets in a PDF, performance data in a spreadsheet and governance in the annual report. A system that finds only one of these sees an incomplete picture, such as a target with no progress, or a policy with no owner.
Fix: create one sustainability disclosure hub that links every report, policy, data file and framework index, with clear names and dates.
6. Poorly structured ESG data tables
Merged cells, unlabelled columns, units hidden in footnotes and charts placed beside tables all confuse extraction. In one report we tested, chart axis labels were extracted in the middle of a data table's rows.
| Before | After |
|---|---|
| A table headed "Emissions" with columns "FY", "CY" and "Target", units in a footnote and a merged header cell | A table headed "Scope 1 emissions (tCO2e), calendar year", one column per year, the base year labelled, and the boundary stated above the table |
7. Website content that automated systems cannot access
According to Vercel's analysis of AI crawler traffic, none of the major AI crawlers, including GPTBot, ClaudeBot and PerplexityBot, executed JavaScript at the time of the study. Pages that build their content in the browser may look empty to them. Bot-protection services, robots.txt rules, logins and broken links can also block retrieval.
Fix: serve key sustainability content as HTML from the server, keep stable URLs, check robots.txt and firewall settings for the crawlers you want to allow, and use descriptive link text such as "2025 Sustainability Report (PDF)" rather than "PDF".
What does AI readiness look like at highly rated companies?
Even companies with top sustainability ratings have gaps in how easily machines can reach and read their disclosures. We reviewed five of them in October 2026. Each scored well in at least one area and had clear room to improve in another. We chose x3 companies that were from the Top 1% of CSA, and x2 companies from the CDP AAA list. We also tried to get companies from a diverse set of industries and regions.
| Company | HQ country | Industry | Why chosen | Sustainability website | Sustainability report |
|---|---|---|---|---|---|
| CNH | United Kingdom (principal office; incorporated in the Netherlands) | Agricultural and construction machinery | Top 1% S&P Global CSA score | Priorities, Targets and Reporting | 2025 Sustainability Report (PDF) |
| Cementos Argos | Colombia | Cement and construction materials | Top 1% S&P Global CSA score | Sustainability | 2025 Integrated Report (PDF) |
| Owens Corning | United States | Building materials | Top 1% S&P Global CSA score | Sustainability | 2025 Sustainability Report (PDF) |
| Clariant | Switzerland | Specialty chemicals | CDP A List for Climate change, Forests and Water | Sustainability | Integrated Report 2025 (PDF) |
| Toyota Tsusho | Japan | Trading and distribution | CDP A List for Climate change, Forests and Water | Sustainability and ESG Data | Integrated Report 2026 (PDF) |
How we tested: for each company we reviewed the sustainability page and main report linked below. We checked robots.txt rules, whether pages load their text without JavaScript, page titles and headings, PDF tagging, metadata and size, and how cleanly key emissions data extracted as text. We used a headless Chromium browser, pdftotext and an AI web-fetch tool. Each area was scored from 1 (poor) to 5 (strong). This is a small, point-in-time review of public pages, not a rating of each company's sustainability performance.

CNH and Toyota Tsusho scored highest overall (24 of 30). Every company scored 4 or 5 in at least one area, and only CNH scored above 3 for its report PDF.
What each area measures: Findability, a clear path from the sustainability page to reports, data and policies. Crawler access, whether pages load without JavaScript and are not blocked. Page structure, titles, headings, meta descriptions and link text. PDF readability, tagging, metadata, size and clean text extraction. Data and context, units, years, boundaries and base years on key figures. Consistency, footnotes, language and terms used the same way throughout.
Example assessment: AI readiness of CNH
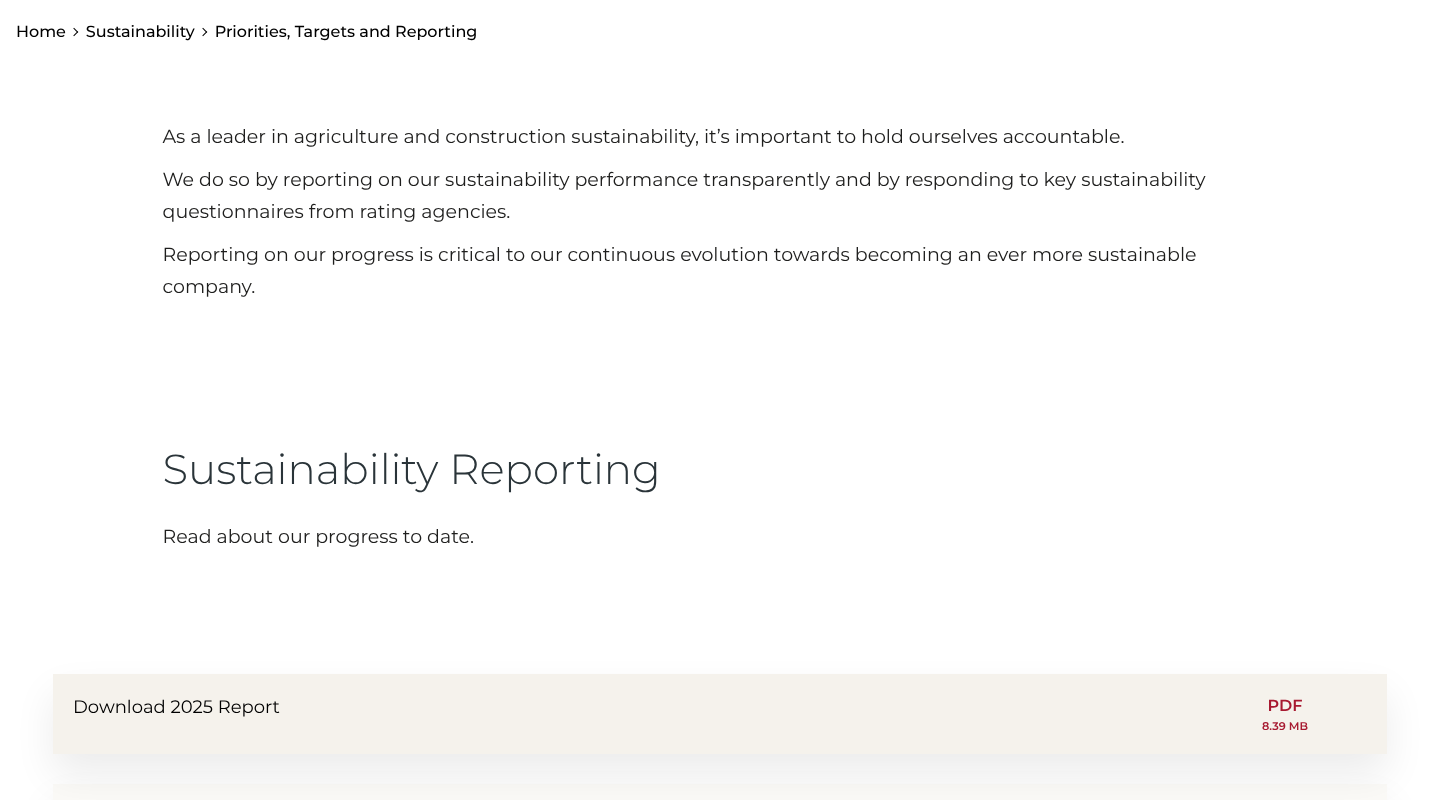
Why chosen: CNH is in the top 1% of its industry in the S&P Global CSA. Its Priorities, Targets and Reporting page is a compact disclosure hub.
What is working well:
- One page links the 2025 Sustainability Report, additional disclosures, the CDP questionnaire and the TCFD report, with file sizes shown.
- The 2030 targets are written in HTML on the page, each with a baseline year (for example, "50% absolute reduction in Scope 1 and 2 emissions vs. 2018").
- The 136-page report is a tagged PDF, and its emissions table extracts cleanly. It gives units, three years of data, the number of plants and the base year, and uses letters, not numbers, for footnotes.
What could they improve:
- The page title reads "Priorities, Targets and Reporting | undefined", and there is no meta description.
- The page has no H1 or H2 headings, so its structure is harder for machines to read.
- Download links are labelled only "PDF", which tells a crawler nothing about the document.
Example assessment: AI readiness of Cementos Argos
Why chosen: Cementos Argos is in the top 1% of its industry in the S&P Global CSA.

Note: Screenshots were blocked because of the site's bot protection.
What is working well:
- The sustainability page links separate environmental, social and governance pages, materiality, policies and the 2025 Integrated Report.
- It names the frameworks it reports against, including GRI, SASB and TNFD-TCFD.
- Report text extracts, and the report states its boundary and base year for its CO2 intensity figure.
What could they improve:
- Bot protection returned "403 Forbidden" to our headless browser and to direct requests for the page, robots.txt and the report. An AI web-fetch tool could read the page, so access depends on which crawler is asking. Companies should check that the AI crawlers they want are allowed through.
- The report link on the page ends in an encoded space ("%20"), which can break strict crawlers.
- The English page has a Spanish title tag, and there are no direct links to GRI or SASB index files.
- When an AI tool read the report's ESG progress chart, it had to infer which values belonged to which labels.
Example assessment: AI readiness of Owens Corning
Why chosen: Owens Corning is in the top 1% of its industry in the S&P Global CSA.

What is working well:
- The sustainability page links the 2025 report, an executive summary, the materiality assessment and a reporting hub, with clear link text.
- Deep links go straight to the right page of the PDF, such as the assurance statement on page 333.
- The report gives eight years of emissions data with units, method (market- or location-based), data coverage and an assurance marker.

What could they improve:
- The page is built in the browser with JavaScript. The HTML the server sends contains none of the page's text, so crawlers that do not run JavaScript would see an empty page.
- The report is 39.5 MB and 337 pages, untagged, with no document title in its metadata.
- Where tables sit beside charts, chart labels were extracted in the middle of table rows.
Example assessment: AI readiness of Clariant
Why chosen: Clariant is on CDP's "A List" for climate change, forests and water. It does not take part in the S&P Global CSA. Its S&P Global ESG Score of 40 is "based on publicly available information and modeling approaches", so how findable its disclosures are matters directly.

What is working well:
- The sustainability page is server-rendered HTML with clear headings, including a section on ESG ratings.
- Its robots.txt explicitly allows AI to use content in answers but not for training ("ai-input=yes, ai-train=no").
- The Integrated Report page offers a "Summarize" button and an AI "Ask a question" assistant.
What could they improve:
- The main "Download" button on the report page is a script action, not a link to a file. The PDF does have a stable URL, but it is only reached through secondary "Read more" links. A plain, labelled link would be easier to find and is what all of our other assessed companies had.
- The 341-page PDF is untagged and its metadata title is just "Integrated Report".
- Numeric footnotes merge into figures when extracted ("by 20303,4"), and the 2030 operations targets on page 35 do not show their baseline year.

Example assessment: AI readiness of Toyota Tsusho
Why chosen: Toyota Tsusho is on CDP's "triple A List" and publishes its sustainability data through a dedicated disclosure site.

What is working well:
- The sustainability site links ESG data, a GRI content index, the integrated report and a human capital report from one place.
- The ESG Data page publishes its data as HTML tables, with units, a labelled base year, the consolidation scope and assurance statements.
- It defines its reporting periods: "20XX" means calendar year and "Fiscal year ended March 20XX" means April to March.
What could they improve:
- The page's H1 is empty, and one H2 on the English page is in Japanese ("ESGデータ").
- The Integrated Report 2026 is 28 MB, untagged and has no metadata title.
- Some data tables use merged cells, which can blur which value belongs to which row or year.
How can companies make sustainability disclosures more AI-readable?
Most fixes are publishing decisions, not new disclosures. Use this checklist to review your current reporting:
- Key pages are served as HTML from the server and load their text without JavaScript
- PDFs are tagged, searchable and carry a document title that names the company, report and year
- Each metric has one name, used the same way in every document, with abbreviations defined
- Every figure states its reporting period, unit, boundary and, for targets, its base year
- One disclosure hub links every report, policy, data file and framework index with descriptive link text
- Policies state who owns them, what they cover and when they were approved or last reviewed
- Data tables use clear headers, one value per cell, no merged cells and units in the header
- Footnote markers next to numbers use letters or symbols, not digits
- Figures match across the annual report, sustainability report, data book and website
- robots.txt and bot-protection settings allow the crawlers you want, and links are stable
How does AI readability affect ESG ratings?
Making a disclosure easier for AI to read does not by itself improve an ESG rating. Ratings depend on each agency's methodology and on what the company actually does. Readability affects whether the evidence you have published is found and correctly understood.
All four major agencies rely heavily on public information:
| Agency | What its published methodology says about sources |
|---|---|
| S&P Global | Around 70% of CSA questions need publicly available data to score any points. For non-participants, analysts complete the questionnaire from public information. Questions with no information found score zero before modelling. |
| Morningstar Sustainalytics | Since 1 July 2025, it no longer accepts non-public information from companies for its ESG Risk Ratings. |
| MSCI | It augments corporate disclosure with alternative data and says it uses technology throughout its data creation process. |
| ISS ESG | Analysts review corporate disclosures alongside media, NGO and government sources, and say source information is generally publicly available. |
Agencies do not publish how much of their extraction is automated, so we cannot provide detailed % of AI scraping. The point remains: whether a human analyst or an AI tool is searching, evidence that is hard to find or ambiguous is more likely to be missed.
How can companies test whether their sustainability disclosures are AI-readable?
The quickest way is an AI-readiness review of your disclosures, and Nossa Data can run it for you. We test your public sustainability information the way ESG analysts and AI systems find it, then show you exactly what to fix.
How a Nossa Data review works:
- Map your key disclosures. We select the 10 to 15 disclosures that matter most to your ratings, mapped to the S&P Global CSA, Sustainalytics, MSCI, ISS ESG and CSRD/ESRS.
- Test retrieval. We check whether AI search tools and automated extraction can find each disclosure on your website and in your reports.
- Check accuracy. We compare what they return with what you published, including years, units and boundaries.
- Score and benchmark. We score you across the six areas used in this article and compare you with your peers.
- Prioritise the fixes. You get a ranked list of changes to your website, reports and data tables, and we retest once they are made.
What you get: an AI-readiness scorecard like the one above, a gap analysis showing where public evidence is missing or hard to find, and practical recommendations your reporting and web teams can act on.
Find out how AI systems see your disclosures
Talk to Nossa Data about an AI-readiness review before your next rating cycle.

Conclusion
The quality of a sustainability disclosure now depends on two things: the evidence behind it, and how easily that evidence can be found and understood. Even top-rated companies lose ground through untagged PDFs, pages built only in JavaScript and figures that lose their context when extracted. Most of these issues can be fixed quickly and cost effectively.
Start by checking whether your most important disclosures can be reliably found and read by the systems your stakeholders now use.
Is your company's sustainability disclosure AI-ready?
Nossa Data helps listed companies improve the quality, completeness and accessibility of their sustainability disclosures across ESG reporting frameworks and rating methodologies.
Discover how Nossa Data can help your team identify disclosure gaps and improve the information available to ESG analysts and automated assessment systems.
Frequently asked questions
Can AI read sustainability reports in PDF format?
Yes, if the PDF contains real text rather than scanned images. Accuracy drops with complex layouts, charts, merged table cells and numeric footnotes, which can merge into the figures they annotate. Tagged PDFs with clear headings and tables extract more reliably.
Why might AI miss information that is already published on a company's website?
The system may not be able to reach it, because of bot protection, robots.txt rules or content that only appears after JavaScript runs. It may also find the page but misread a figure that lacks a year, unit or boundary.
Do ESG rating agencies use AI to assess corporate sustainability disclosures?
Agencies describe using technology in data collection, but they do not publish how much is automated. What their methodologies do make clear is that public disclosure is central. S&P Global needs public data for around 70% of CSA questions, and Sustainalytics no longer accepts non-public information from companies.
Can poor website structure affect ESG data collection?
Yes. If policies, targets and data are spread across pages with unclear links, an analyst or automated system may find only part of the evidence. A central disclosure hub with descriptive links, stable URLs and server-rendered pages makes complete collection more likely.
How can companies make ESG disclosures easier for AI to interpret?
State the reporting period, unit, boundary and base year for every figure. Use consistent metric names that follow recognised frameworks such as GRI or ESRS. Publish key data in clear HTML tables as well as PDFs. See the checklist above.
Sources
- S&P Global ESG Scores Methodology
- S&P Global CSA methodology documents
- S&P Global ESG Score: Clariant AG
- Sustainalytics: ending the acceptance of non-public information for ESG Risk Ratings
- MSCI ESG Ratings
- ISS STOXX research methodology
- W3C: PDF Techniques for WCAG 2.0
- GRI: A digital leap forward for sustainability reporting
- Vercel: The rise of the AI crawler (December 2024)
- ESGReveal: an LLM-based approach for extracting structured data from ESG reports (arXiv, 2023)
- Weichel, Simon and Schäfer: Robust Table Information Extraction from Sustainability Reports (ClimateNLP 2025)
- Company pages and reports as linked in each example assessment, reviewed 26 October 2026