Why the EY and PwC CSRD examples matter
The 2026 ESRS were adopted by the European Commission on 3 July 2026 and published in the Official Journal on 21 September. Within weeks, EY and PwC had each released material showing how they expect the revised standards to be applied. For any listed company whose sustainability statement is reviewed by one of the Big Four, both are worth reading closely, since they give a good indication of what the auditor will look for.
The two firms took different routes. EY wrote a full sustainability statement for a fictitious listed bank, Good Bank ESRS Limited. PwC updated the first five chapters of its Sustainability reporting guide (SRG). The guide sets out PwC’s interpretations and illustrates each one with a short case about a fictitious company: a fertiliser-heavy farm, an oil producer, a fashion retailer with a problem supplier.
In this article we compare the two on structure, value chain, materiality and the presentation of impacts, risks and opportunities (IROs). We then look at two areas where both firms spend a lot of time: the link to the financial statements, and the disclosure of reliefs and corrections.
What EY and PwC published on the 2026 ESRS
EY’s Good Bank ESRS Limited (second edition, October 2026) runs to 119 pages. The bank is listed, incorporated in a fictitious member state called Euroland, and operates in Europe and Asia-Pacific. It offers corporate lending, capital markets advisory, mortgages, asset finance and, after an acquisition during the year, asset management. EY assumes a Wave 1 entity, with turnover above €450 million and more than 1,000 employees, in its third year of reporting. It also assumes the bank has chosen to apply the 2026 ESRS in full rather than staying on Set 1 with the new reliefs.
The scope is narrower than a real report would be. EY covers ESRS 1 and 2, E1 Climate change, S1 Own workforce and G1 Business conduct, plus one entity-specific topic, cybersecurity over data privacy. Figures are placeholders (“XX” for 2026, “YY” for 2025, “ZZ” for baselines). Commentary boxes appear throughout: yellow boxes explain how a metric was calculated, and grey boxes explain why EY made a particular presentation choice. Readers outside financial services are directed to a sister document, Good Group Brewery ESRS, EY’s equivalent illustration for a non-financial company.
PwC’s document is longer (283 pages) and is not a report. Chapters 1 to 5 of the SRG cover the reporting landscape, who is in scope of CSRD after the Omnibus changes, where the reporting boundary lies, how to assess materiality, and the “foundations”: fair presentation, proportionality, connectivity, measurement and presentation. ESRS (2026) is compared with IFRS S1 throughout. The topical chapters for E1 to G1 under ESRS (2026) have not yet been published, so for now PwC’s topical guidance still refers to ESRS (2023).
Both documents build on information materiality and fair presentation, both stress that disclosures must follow the company’s own facts, and both tie their points to specific paragraphs of the standard. The difference is mainly in format. EY shows what the finished statement looks like, while PwC explains the judgements needed to produce it.

1. Sustainability statement structure under the 2026 ESRS
ESRS 1 (2026) paragraph 105 still requires four parts in a fixed order: general information, then environmental, social and governance information. An appendix is optional. PwC sets this out in Figure SRG 5-10 and then explains where companies have flexibility. A different structure is allowed if the company gives “a reasoned explanation” for it. An executive summary is optional, but once included it forms part of the statement and must meet the same quality standards. EU Taxonomy disclosures may go in an appendix, provided they are clearly labelled as part of the sustainability statement. In Question SRG 5-8, PwC also confirms that IROs may be presented next to their policies, actions and targets in the topical sections, as long as IRO-2 still contains a short description of each one (ESRS 2 AR 28).

Source: PwC, Sustainability reporting guide, Figure SRG 5-10, p. 5-38.
EY follows the default structure. The statement opens with a one-page executive summary. It describes the bank’s business, its strategy (Banking with Purpose, Investing in Tomorrow) and its three pillars: net-zero financing, an inclusive workforce, and trust and financial-system integrity. It names the material topics and explains how the year’s two acquisitions were treated. The general disclosures that follow are notably specific. The GOV-1 table names four Board committees and what each oversees in sustainability. The Sustainability Committee is chaired by the CEO, while the Audit Committee oversees “the integrity of the Bank’s financial and sustainability disclosures”. GOV-2 shows that up to XX% of the executive team’s variable pay under the long-term incentive plan depends on sustainability targets. These include net zero in operational and supply-chain emissions by 2030, a sustainable finance volume target, and the share of women in top management by 2028 and 2030.
Two features of EY’s structure are useful to copy. First, section 1.5 brings every policy into one table, with columns for content, the IRO it addresses, scope and the third-party standards it follows, so the topical chapters do not repeat it. The Supplier Code of Conduct, for example, is linked to the operational-emissions IRO and to the UN Global Compact, ILO core standards and the UN Guiding Principles. Second, the appendix lists every disclosure requirement with its section number, the datapoints that also serve SFDR, Pillar 3, the Benchmark Regulation and the EU Climate Law, and what is incorporated by reference. GOV-1 is incorporated from the Corporate Governance section and GOV-2 from the Remuneration Report.
EY also tags every paragraph with its datapoint, for example [ESRS-2_SBM-1_20b(ii)]. You would remove these tags before publication, but in a working draft they give the assurance team a ready audit trail.
2. ESRS value chain mapping examples
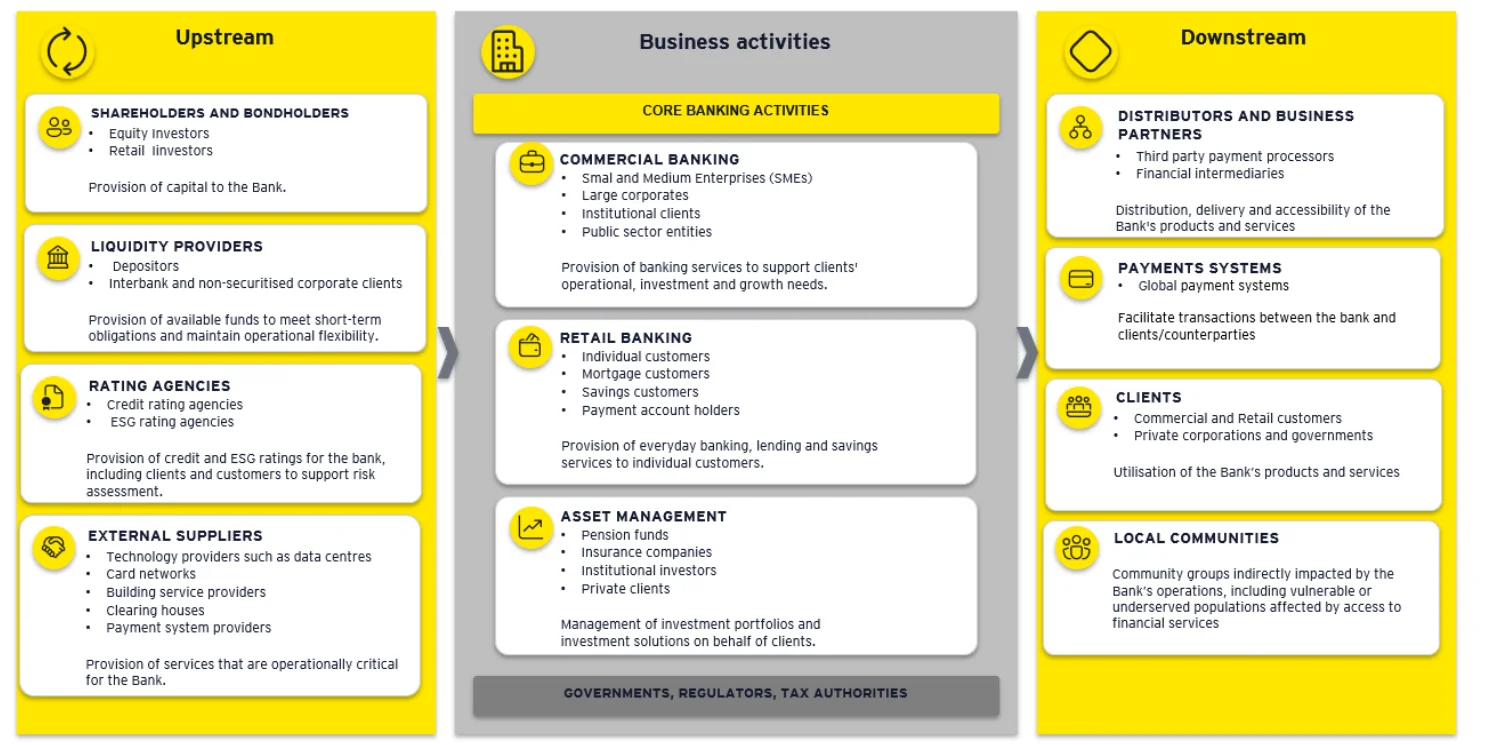
EY’s value chain map (SBM-1, page 23) is three columns of boxes, each naming a stakeholder group and describing what it contributes to, or receives from, the bank:
Source: EY, Good Bank ESRS Limited, SBM-1, p. 23.
For a bank, the upstream column contains capital and liquidity providers rather than suppliers of materials. This shows that the map should reflect your own business model, not a generic manufacturing template. EY reuses the same stakeholder groups in the SBM-2 engagement table, which records what each group wants, how the bank engages with it and how that affects strategy. External suppliers, for example, want “responsible procurement practices” and “collaboration on decarbonisation”. The bank engages with them through quarterly meetings, surveys and due diligence, and the relationship feeds into how it manages upstream emissions. Because the IRO table also labels every item U, O or D, a reader can follow a single stakeholder from the map through to the material IROs.
EY’s second illustration, Good Group Brewery ESRS, shows the same disclosure for a manufacturer. Here the value chain is organised by activity rather than by stakeholder. Upstream covers barley and hop sourcing, water and other ecosystem inputs, packaging (bottles, cans, materials) and farm and processing workers. Own operations covers brewing and bottling, internal logistics, head office and workforce management. Downstream runs from distribution and marketing through retail and hospitality to consumption and end-of-life packaging, with recycling feeding back into packaging inputs.
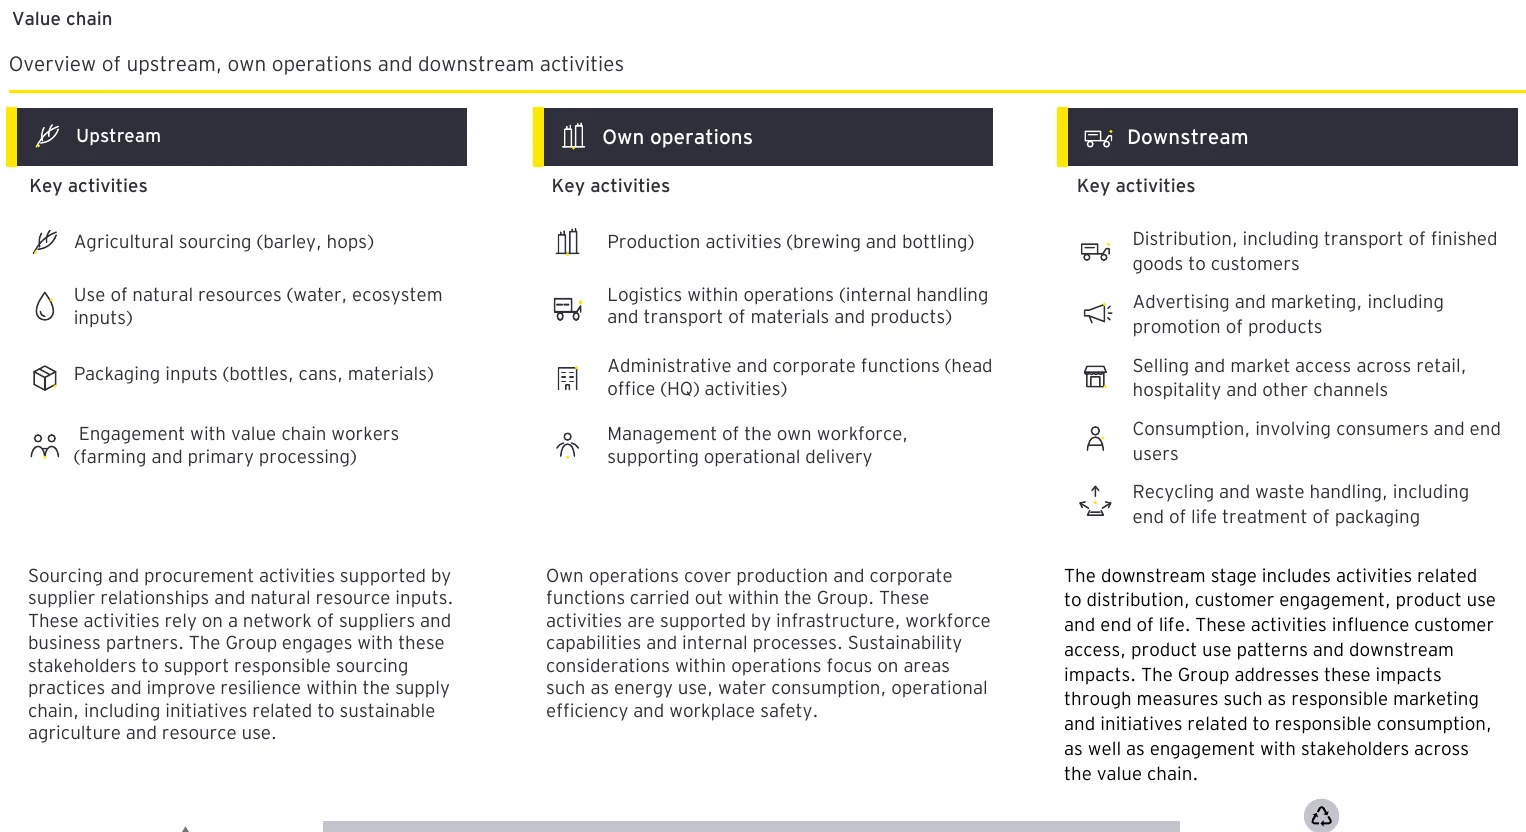
Source: EY, Good Group Brewery ESRS, SBM-1, p. 18.
On the following page, the Brewery draws the same chain as a single illustration. It labels nature as a “silent stakeholder” and shows workers in the value chain as a group in their own right, separate from the Group’s employees. For any company whose material topics include E4 or S2, that is a simple way to show the DMA covered stakeholders who cannot speak for themselves.

Source: EY, Good Group Brewery ESRS, SBM-1, p. 19.
PwC deals with what sits underneath the map. In SRG 3.3 it makes three points:
- The boundary extends into the value chain only as far as the materiality assessment finds material IROs there. In PwC’s words, “the specific limits of the entity’s reporting boundary in the value chain depend on the outcome of its materiality assessment”.
- Business relationships go beyond tier 1 and include joint ventures, associates and other investments (ESRS 1 (2026) paragraph 62).
- From financial years beginning on or after 1 January 2027, a value chain cap applies. A “protected undertaking” (a value chain partner with an average of no more than 1,000 employees) can decline requests for data beyond the voluntary standard. Under Question SRG 5-5, a self-declaration of protected status may be relied on unless you know, or should reasonably know, that it is “manifestly incorrect”.
PwC’s own diagram makes the point visually. The value chain is a network of upstream and downstream relationships around own operations, and the shaded circles mark where material IROs sit. Those circles determine how far the reporting boundary extends.
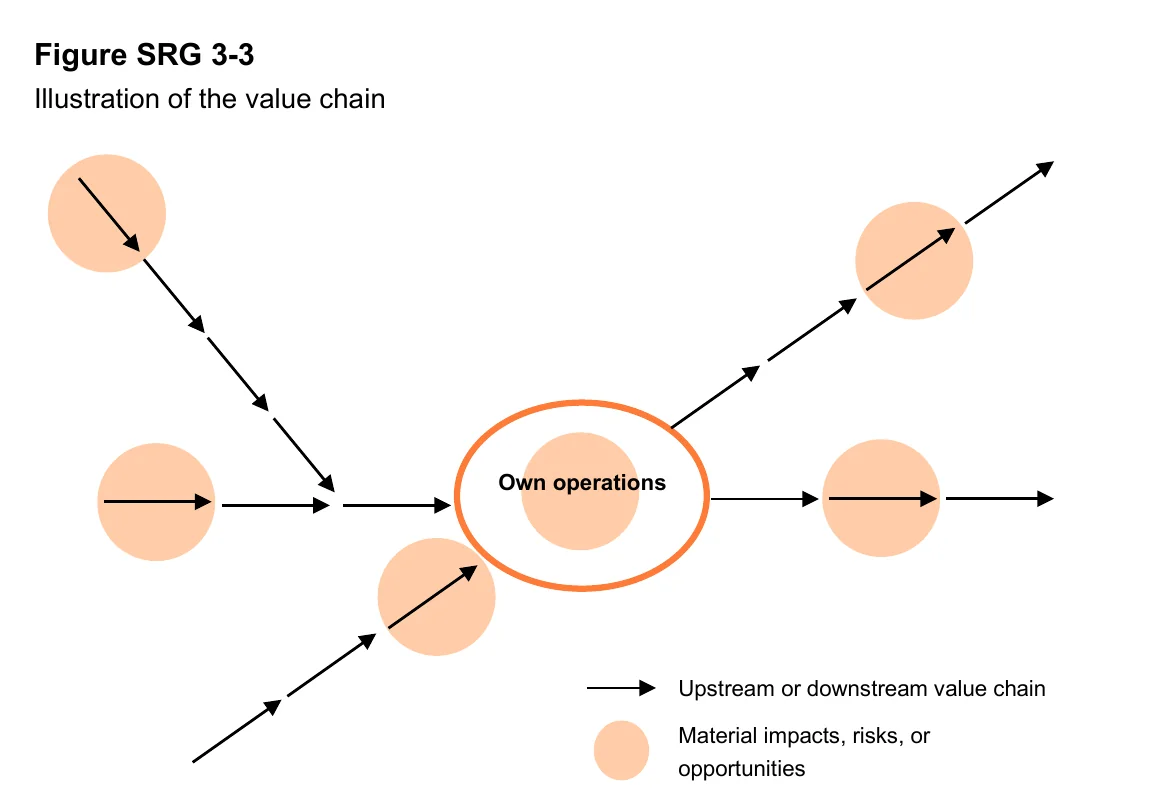
Source: PwC, Sustainability reporting guide, Figure SRG 3-3, p. 3-13.
The two documents overlap on fiduciary investments. When EY’s bank acquires the asset manager EAM, it uses the 2026 exemption in ESRS 1 AR 17 to exclude client money managed under mandate, where EAM keeps no risks or rewards of ownership, from the DMA entirely. PwC discusses this carve-out in SRG 3.3.2.3 and notes in Question SRG 3-8 that IFRS S1 has no equivalent. That matters for any group reporting under both frameworks.
PwC’s Fabrics Corp case (Example SRG 4-5) shows what happens when mapping stops at tier 1. The retailer’s main supplier, Connections Ltd, sources most of its clothing from Manufacture Ltd, whose labour conditions fall short of international standards. Fabrics Corp has no contract with Manufacture Ltd. Even so, the impact on workers is “directly linked” to its products, and there is a related financial risk: the brand damage has not yet reduced revenue, but it is “reasonably expected to have a significant effect on future revenues”. Both must be assessed.
3. Double materiality assessment (DMA) examples
The 2026 ESRS formally recognise two ways of running the DMA. Under a “top-down” approach, you reach a conclusion at topic or sub-topic level from your strategy, sector, geographies and value chain. Under a “bottom-up” approach, you assess individual IROs (PwC, Figure SRG 4-9). PwC’s view is that both routes should arrive at the same answer, and that you do not need to run both. In Question SRG 4-2 it adds an important qualification: even if a topic is assessed top-down, the statement must still identify and describe the individual material IROs within it. The level at which you assess does not set the level of detail you disclose.
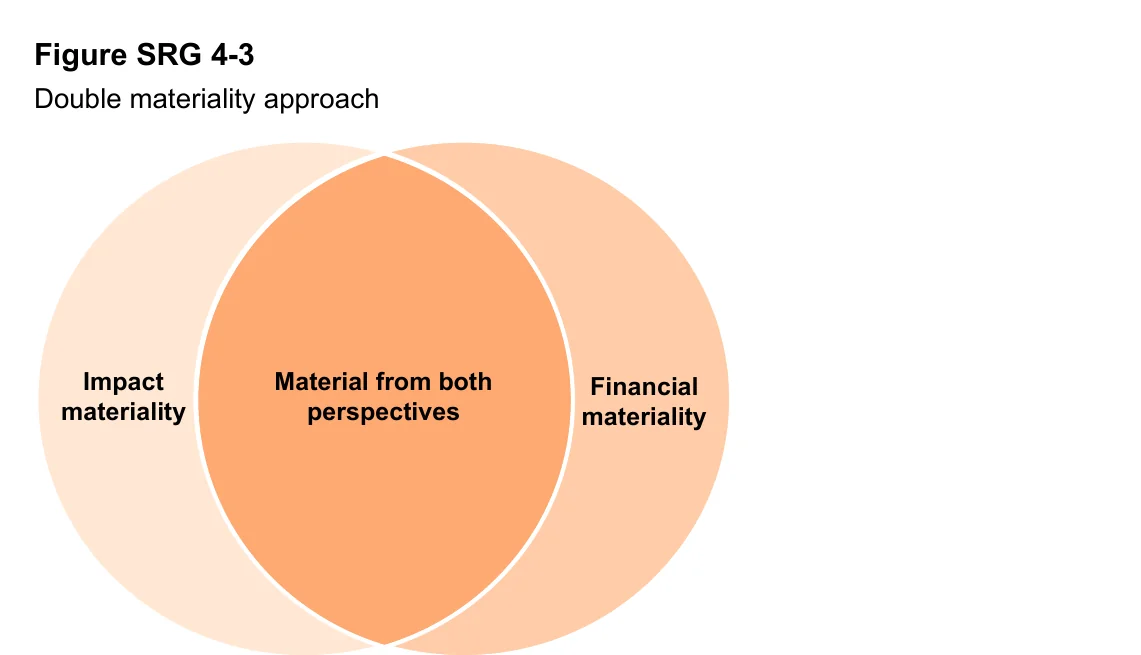
Source: PwC, Sustainability reporting guide, Figure SRG 4-3, p. 4-7. A topic is material if it is material from either perspective, or both.
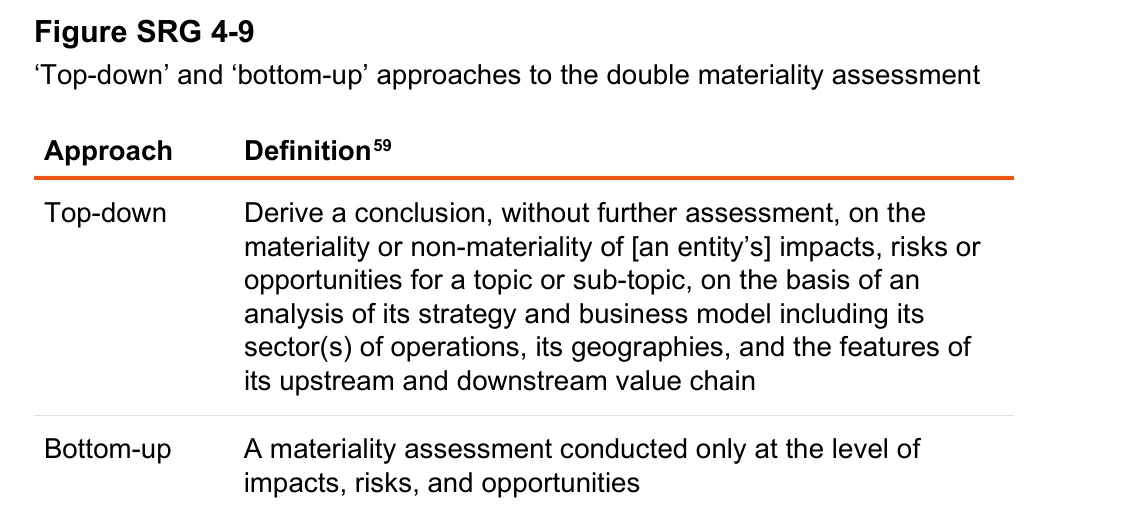
Source: PwC, Sustainability reporting guide, Figure SRG 4-9, p. 4-20.
EY’s bank uses both approaches in a five-phase process. Phase 1 is a top-down screen built on an internal “sustainability risk drivers framework”, shown on page 32 as three linked columns:
- Sustainability triggers: physical and transition climate risk, ethics and privacy, cyber and AI, corruption and bribery, negative effects on employees, and shifts in customer and investor preference.
- Economic transmission channels: direct climate effects such as property damage, indirect macro effects such as GDP or commodity shocks, and indirect micro effects on counterparties such as crop losses or cost increases, alongside direct social and governance effects such as legal liability or loss of customers.
- Potential financial effects: credit risk, funding and liquidity risk, market risk in the banking and trading books, operational, compliance and model risk, liabilities and loss of revenue.
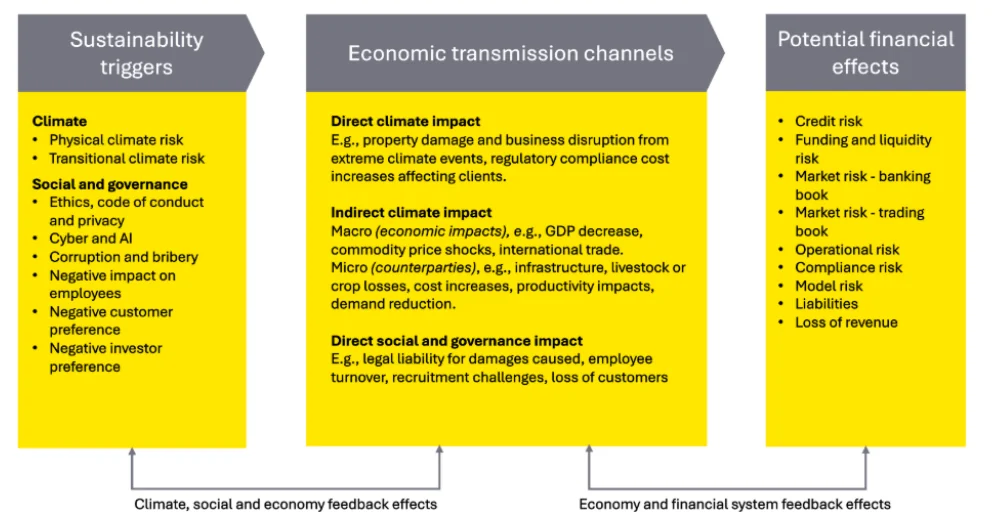
Source: EY, Good Bank ESRS Limited, IRO-1, p. 32.
The framework is aligned with the central bank’s expectations on climate and environmental risk. EY describes it as “a single comprehensive risk assessment” used for both prudential reporting and the ESRS. A bank’s DMA should look like this: it should be connected to the risk function rather than run as a separate sustainability exercise.
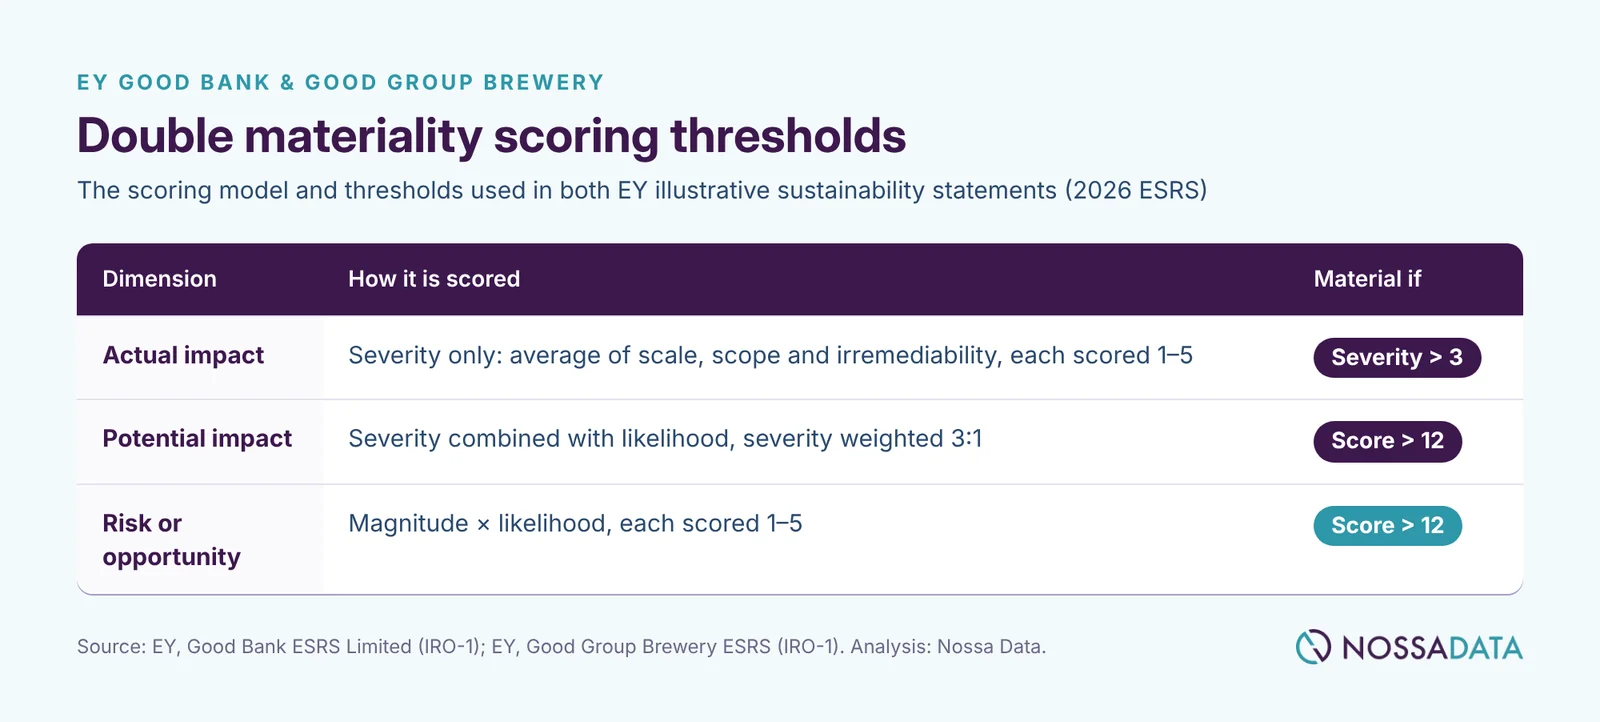
Where the top-down screen cannot settle a topic, the bank scores individual IROs. EY sets out the thresholds in full:
View as table
| Dimension | How it is scored | Material if |
|---|---|---|
| Actual impact | Severity only: average of scale, scope and irremediability, each scored 1–5 | Severity above 3 |
| Potential impact | Severity combined with likelihood, severity weighted 3:1 | Score above 12 |
| Risk or opportunity | Magnitude × likelihood, each scored 1–5 | Score above 12 |
The Brewery uses exactly the same scoring model and thresholds, and EY publishes the full 5 × 5 grid. The cells scoring above 12 (15, 16, 20 and 25) are shaded as material. Everything else, including a “high” severity at “possible” likelihood (12), falls below the line. Showing the grid makes it obvious how much depends on that one threshold, which is the reason both illustrations add an expert-review step for IROs that score just below it.
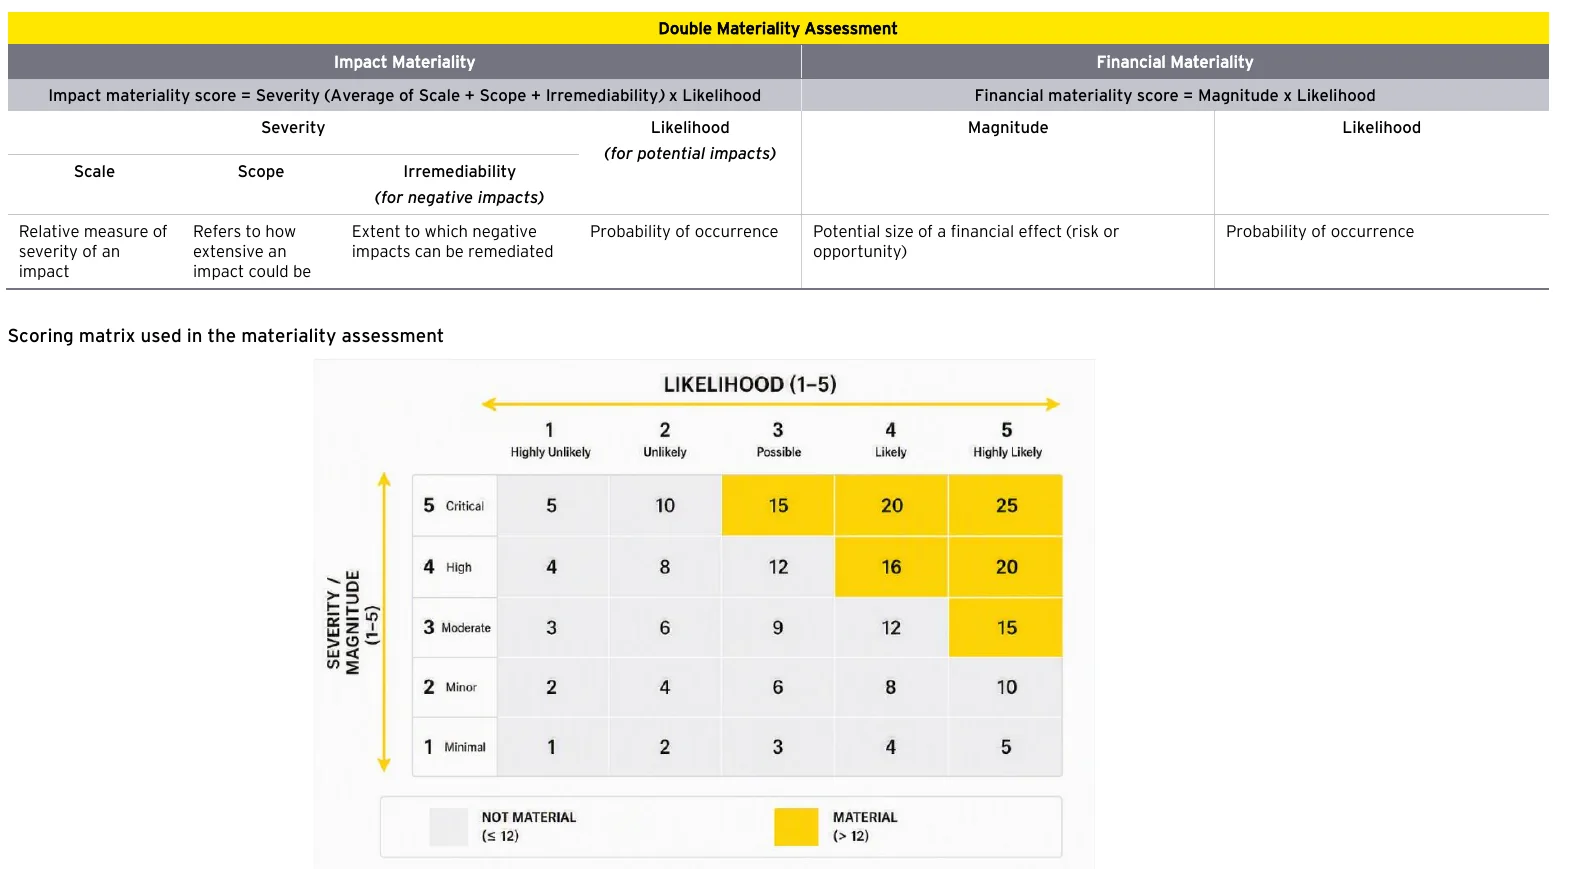
Source: EY, Good Group Brewery ESRS, IRO-1, p. 26.
The Brewery’s choice of example is also worth noting. Where the Bank uses anti-corruption to show that strong controls do not make an impact immaterial, the Brewery uses health and safety: impacts “are still considered material by the Group even where comprehensive health and safety policies, training programmes and controls are in place”. Its information-materiality outcome also differs. It omits training and skills development (S1-12) and work-life balance (S1-14), but reports health and safety in full, because that is where its material workforce IROs lie.
The working group can propose moving a topic with several IROs that score just below the threshold, but the CSO and CFO, as co-sponsors, must approve each change on a documented basis. Final approval sits with the Board, on the joint recommendation of the Sustainability and Risk functions.
PwC’s examples deal with judgements that a scoring grid cannot make for you. Gray PLC (Example SRG 4-2) has a pollution leak that it stops within a week. That containment reduces the actual impact assessed. The later clean-up of the soil and aquifer, and the restoration plan it announces, do not, because they come after the event. Sea Corp PLC (Example SRG 4-3) reassesses an offshore oil spill every year from 20X0 to 20X4, and stops treating it as material only once independent surveys confirm that the clean-up is complete. Farm Company (Example SRG 4-1) has to consider fertiliser use with little effect today but severe cumulative damage to biodiversity over time. Seaside PLC (Example SRG 4-7) has to recognise long-term flood risk at a plant that has never flooded, even though “a quantitative analysis is not required to identify risks”.
The Sea Corp case is the most useful of these to look at in full, because PwC sets out the timeline and then the assessment for each year. The analysis table also shows something preparers often miss. The spill creates more than one item to assess: the actual impact, a potential impact from the capped pipeline, and a potential impact from other pipelines with similar characteristics.

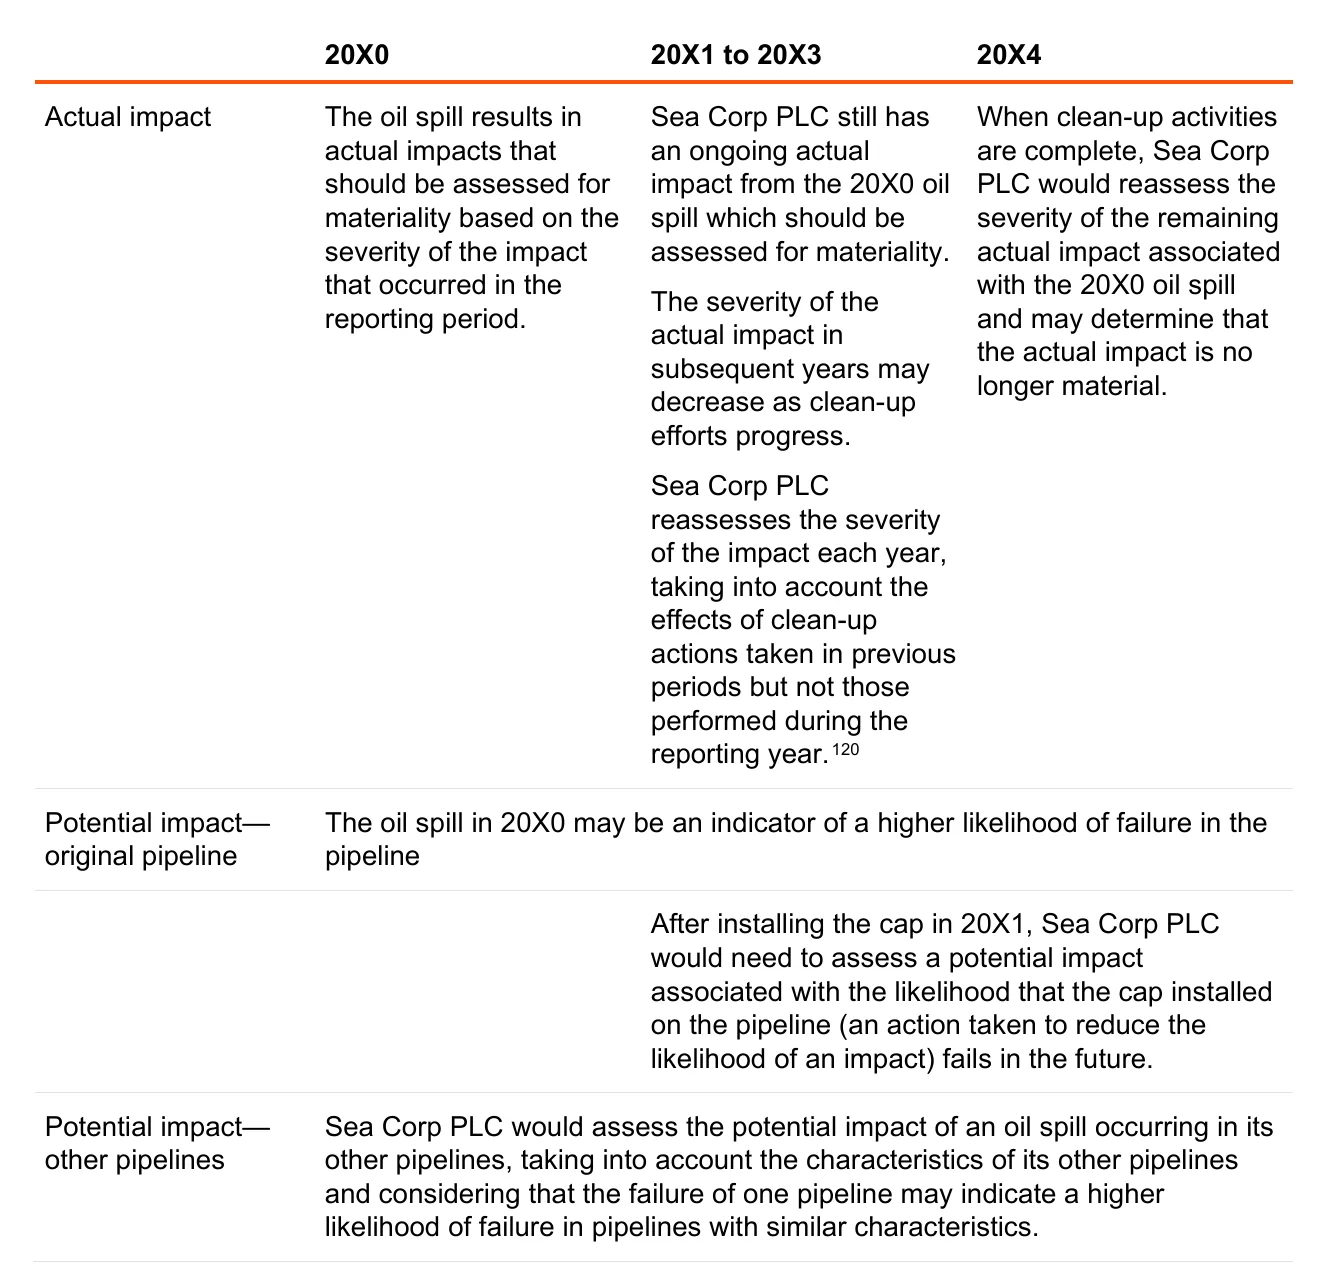
Source: PwC, Sustainability reporting guide, Example SRG 4-3, pp. 4-43 to 4-44.
EY’s methodology applies the same principles to a bank. Remediation in the current period does not reduce the severity of an actual impact. Planned actions are ignored until they are implemented. Positive impacts are never netted against negative ones. Most usefully, EY does not treat strong controls as a reason for immateriality. Corruption and bribery remain material “even where comprehensive anti-corruption, anti-bribery, and anti-money laundering policies, training programmes and controls are in place”, and that is despite G1-4 reporting no incidents, convictions or fines in either 2025 or 2026.
Two smaller PwC points are useful in conversations with investors. A request from a single investor does not by itself make information material (Question SRG 4-1). Equally, a small number is not automatically immaterial. In Example SRG 4-8, Northstar PLC’s supply disruption cost only 0.3% of revenue, but it explains why the company has signed a new long-term sourcing contract in a higher-risk region, so both are disclosed.
After the DMA, EY applies an information-materiality filter (phase 4). Having S1 as a material topic does not mean reporting all of S1. The bank found no material IROs for health and safety (S1-13), work-life balance (S1-14) or supplier payment practices (G1-6), and omits those disclosure requirements. PwC (SRG 4.7.2) points out that the filter is wider under ESRS than under IFRS S1. Information about impacts on people or the environment can be material to other users even when it would not influence an investor.
4. Communicating impacts, risks and opportunities (IROs)
EY lists all material IROs in a single IRO-2 table with five columns: a short title, a description, the category (actual or potential impact, risk, opportunity), the value chain location (U, O or D) and the chapter where it is covered. There are 11 rows. The climate entries show the pattern most clearly, because the impact, risk and opportunity from the same activity sit next to each other:
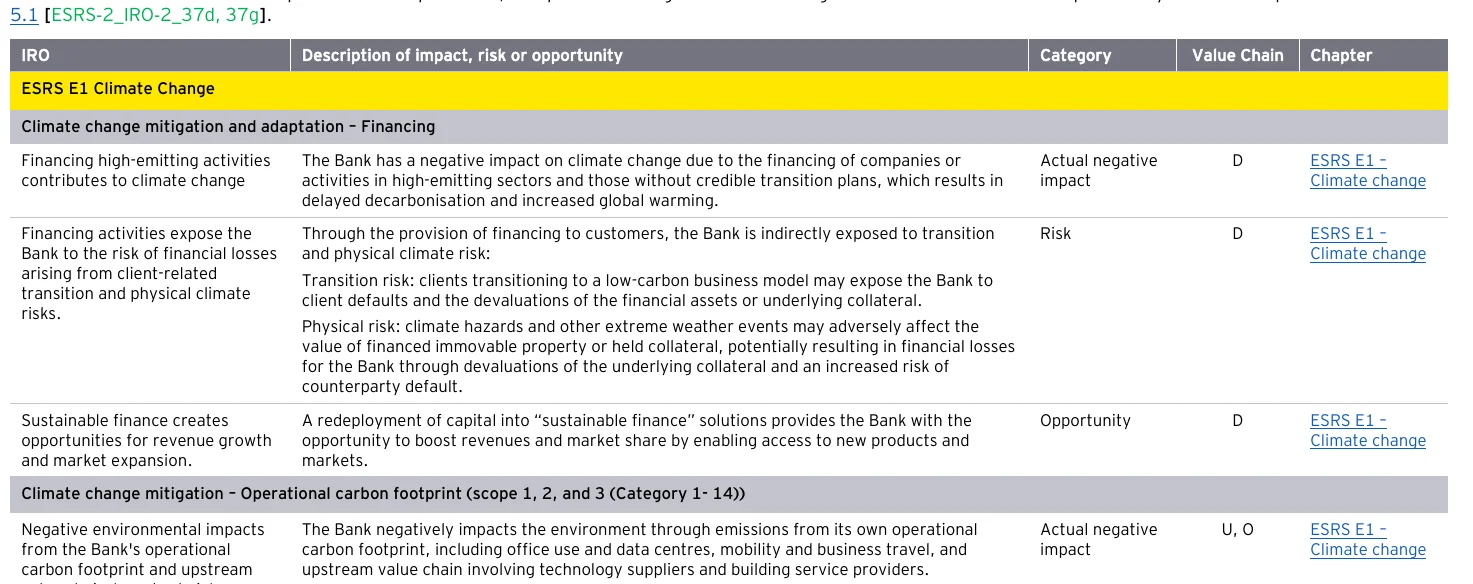
Source: EY, Good Bank ESRS Limited, IRO-2, p. 36.
The descriptions are specific to the bank. The physical-risk entry, for example, explains that extreme weather “may adversely affect the value of financed immovable property or held collateral”. In the S1 rows, the risk from poor inclusivity is described in terms of lower retention, higher hiring costs and legal exposure. Each IRO also appears elsewhere in the statement: SBM-3 places it under one of the three strategic pillars, the policy table names the policies that address it, and E1-11 or its S1 or G1 equivalent quantifies any financial effect.
The Brewery’s IRO-2 table uses the same five columns, with the IROs grouped under the ESRS sub-topic headings, which makes each line easy to check against the standard. Its climate entries separate the impact from its own brewing operations (O) from the impact across its value chain (U, D). They also split physical risk into acute (“extreme weather events may disrupt production operations and supply chain”, U, O, D) and chronic (“changing climate patterns may result in supply chain disruptions” affecting the agricultural inputs essential for brewing, U). The S1 rows show the same pairing as the Bank’s. “Unsafe workplace practices” is an actual negative impact, and “weak health and safety management practices” is the related risk of disruption, absenteeism and higher costs. On governance, ineffective whistleblowing channels are recorded as a potential negative impact across U, O and D, because poor channels undermine trust “across the Group’s operations and business relationships”. The governance results also differ between the two companies. The Brewery reports lobbying governance as a material risk and late payment to SME suppliers as a potential negative impact (G1-6). The Bank assessed both as not material, reported political engagement only as supplementary information, and omitted G1-6 altogether.
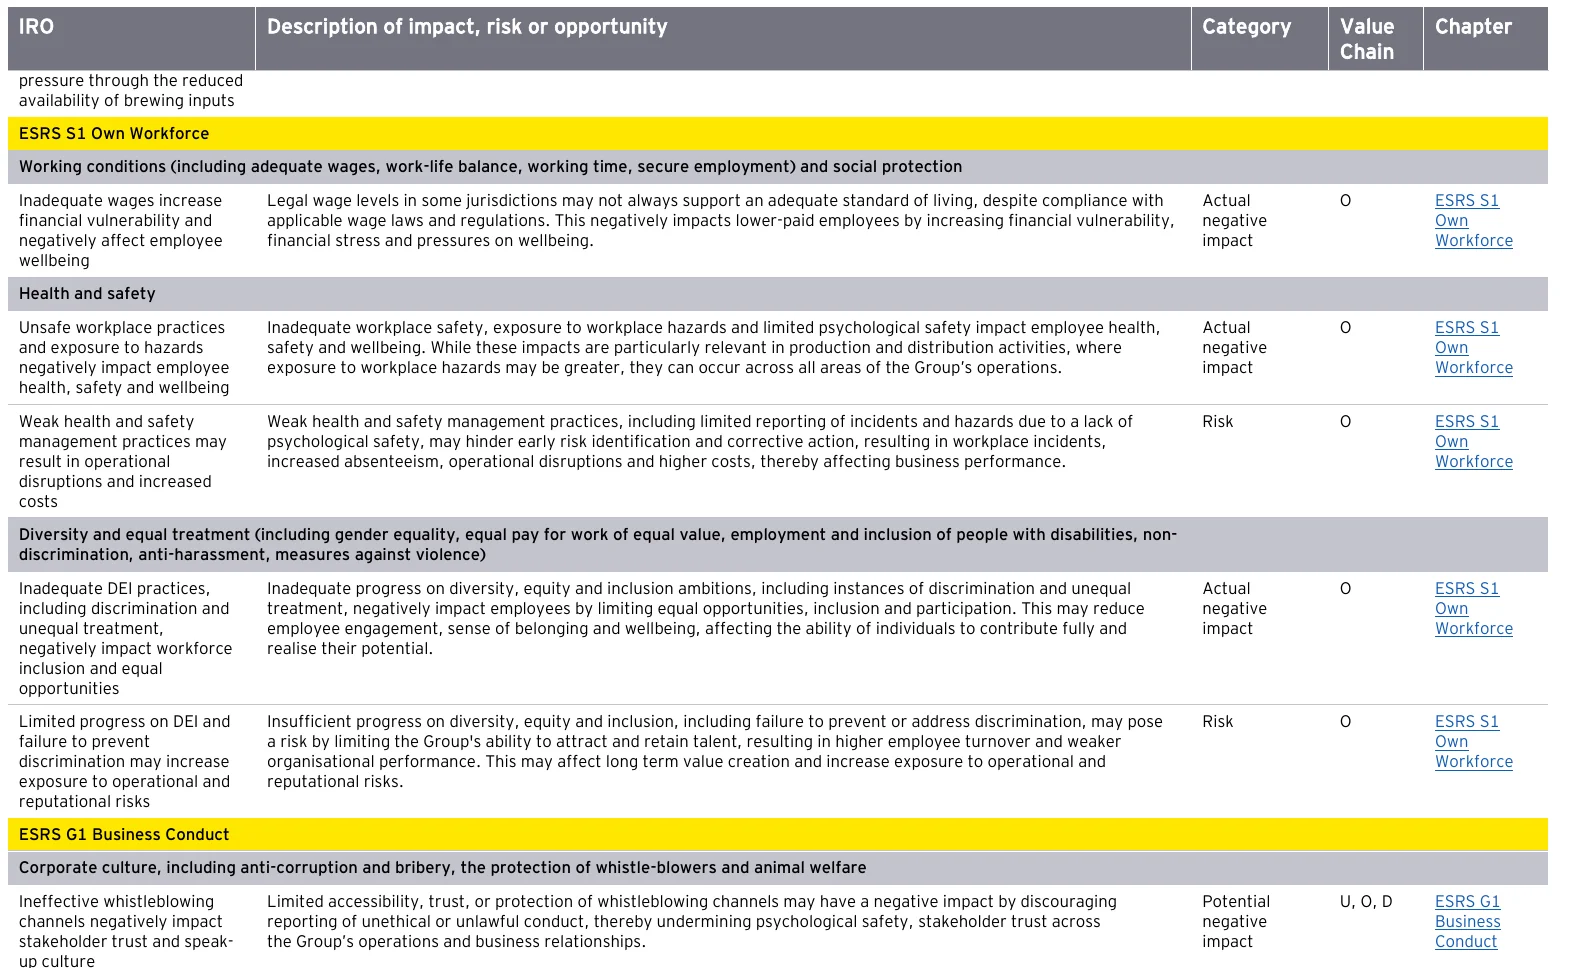
Source: EY, Good Group Brewery ESRS, IRO-2, p. 29.
Cybersecurity shows how the 2026 ESRS deal with a topic that is not on the standard list. EY reports “inadequate cybersecurity governance over data privacy” as an entity-specific potential negative impact, alongside a risk of operational disruption and financial loss. PwC’s Question SRG 4-4 explains why this is acceptable. Cybersecurity is not in ESRS 1 Appendix A, but EFRAG’s basis for conclusions calls it “a key sustainability issue”, which can be reported under an existing data-privacy sub-topic or as an entity-specific topic.
EY also uses commentary boxes to cover what was not found. Climate is material, so the IRO-2 37(b) explanation of why it is not material is not needed. No heightened risk of forced or child labour was identified (37(f)), and the IROs are unchanged from the prior year (37(c)). Political engagement was assessed as not material, but because the bank is heavily regulated, it still reports its trade association spending (for example, with Euroland’s Banking Association) in a supplementary section. EY points out that supplementary disclosure must be labelled as such, and that non-material information should not otherwise appear in the statement.
PwC’s role here is to explain how impacts and risks connect. In Example SRG 4-4, Farm Corp’s pesticides harm the bees that pollinate its crops, so an impact on nature becomes a risk to future yields through a dependency. In Fabrics Corp, a single labour problem at a tier 2 supplier gives rise to both an impact and a risk. Before you finalise the table, check that each impact you record has been followed through to any risk it creates, and that each risk can be traced back to an impact or a dependency.
PwC’s Figure SRG 4-16 is a useful check for that review. Impacts go outwards from the company to people and the environment. Dependencies come back the other way. Risks and opportunities can arise from impacts, from dependencies or from other external factors, and only then lead to financial effects.

Source: PwC, Sustainability reporting guide, Figure SRG 4-16, p. 4-47.
5. Connectivity between the sustainability statement and the financial statements
PwC’s clearest example is Seaside PLC (Example SRG 5-1). The company commits to replacing its fossil-fuel delivery fleet with electric vehicles within three years. It spends €10.5 million in the current year, expects to spend another €20 million, and books a €15 million impairment in cost of sales for vehicles it will now retire early, described in Note 8. PwC’s analysis is that the sustainability statement should describe the transition plan, separate the money already spent from the money still to be spent, and refer to the impairment and the note. The data and assumptions should be the same as those used in the accounts (SRG 5.4.3).
EY shows the same discipline for a bank. In section 2.6.1, climate risk appears as IFRS 9 expected credit loss management overlays, split between transition risk and flood risk, with comparatives and a reference to the note. EY also acknowledges that the climate effect within the modelled provisions “cannot be separately identified”, which reads as a candid statement rather than an omission. Section 2.6.2 discloses Euroland loans secured on property at material flood risk, broken down by sector, maturity bucket (5 years or less, 5 to 10 years, over 10) and chronic versus acute flooding. The time horizons (to 2027, 2027–2032, beyond 2032) are described as matching the bank’s planning and capital allocation cycles. The resilience analysis in SBM-3 feeds into the ICAAP.
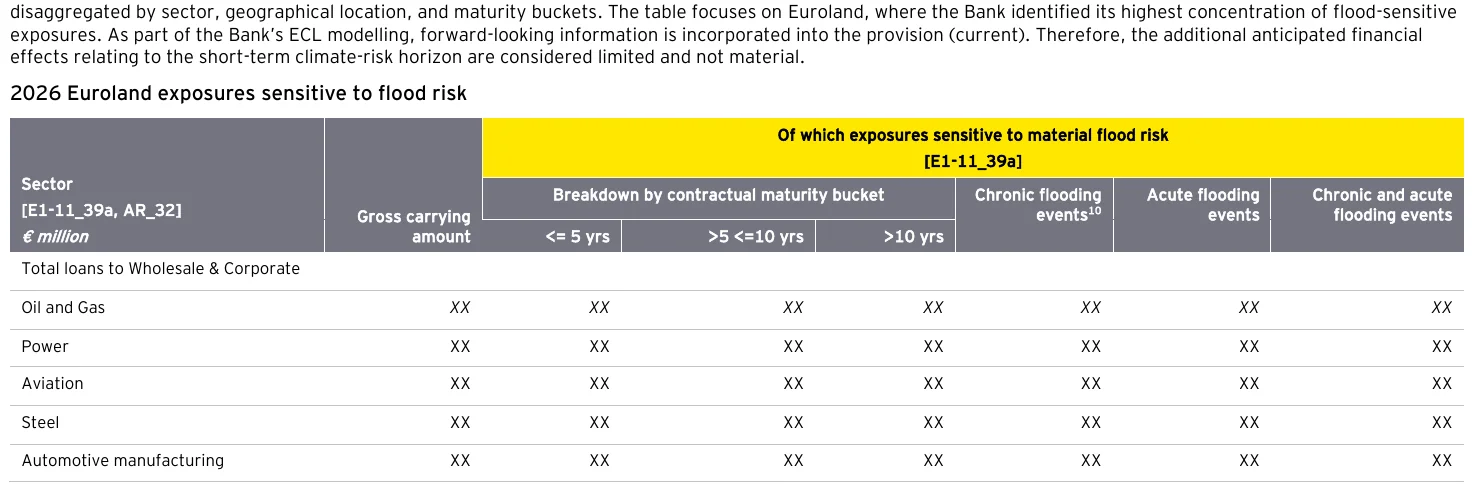
Source: EY, Good Bank ESRS Limited, E1-11, p. 76.
The Brewery shows what to disclose once a physical risk has actually occurred. In April 2026, unusually heavy rainfall flooded part of a warehouse in Asialand. EY sets out each financial effect separately and gives the location in the accounts for each: restoration and clean-up costs recognised as operating expenses, impairment of equipment that could not be restored, and capex on replacements within property, plant and equipment, each with a note reference. It then covers the remaining questions an auditor would ask. An impairment review of the rest of the warehouse found no further loss. Insurance recoveries were not material because the claims were still under assessment at year-end. Revenue was not significantly disrupted because operations moved to other sites. No transition-risk effects arose in the year. The Brewery’s time horizons (2027, 2028–2032, beyond 2032) are linked to asset lives: 15 to 30 years for buildings and 10 to 12 years for machinery, so both are assessed across every horizon.
The climate targets are linked to the business in the same way. EY sets decarbonisation targets for the ten highest-emitting sectors in the loan book, each with a stated reference pathway. Oil and gas follows the IEA Net Zero 1.5°C scenario and covers clients’ Scope 1, 2 and 3 emissions. Residential mortgages follow CRREM 1.5°C and are measured as an intensity in kgCO₂e per m². Each target lists the actions behind it, such as green remortgages with reduced fees for upgrades to EPC A to C. The transition plan also lists what lies outside the bank’s control, including policy, real-economy decarbonisation, client action and data quality, and how locked-in emissions in the loan book are limited through sector policies.
6. ESRS reliefs, estimates and prior-period corrections
EY’s BP-1 “specific circumstances” table brings together, on one page, the items that companies often scatter through the report or leave out:

Source: EY, Good Bank ESRS Limited, BP-1, p. 14.
The Brewery’s version of this table follows the same structure. Scope 2 location-based and Scope 3 emissions for 2025 are revised after database improvements and better supplier-specific data, each with the percentage change. An error in the 2025 annual remuneration ratio, caused by an incomplete numerator, is restated. As with the Bank, one acquisition is in and one is out. Good Brewery Research Ltd, acquired in February 2026, is included from its acquisition date, while Good Brewery Packaging Ltd, acquired in November 2026, is excluded under the acquisition relief until 2027. Using the same pattern in both illustrations suggests EY expects this split treatment to be common in practice.
Two details are worth noting. First, the two acquisitions are treated differently, and EY’s commentary says the relief “is not a policy election that must be applied consistently”. PwC reaches the same conclusion in Question SRG 3-11, using a similar example of a first-day acquisition compared with a last-day one. Second, the cyber omission goes through all four conditions in ESRS 1 paragraph 100(a): a fair understanding is not prevented, aggregation was considered and rejected, the omission is disclosed, and it is reassessed every year. If you intend to rely on commercial prejudice, EY’s wording shows the standard of documentation expected.
The acquisition also affects the S1 targets. EY moves the baseline for women in top management and the adjusted gender pay gap from 2021 to 2026 to reflect the enlarged group, and discloses the recalculated baselines in a footnote.
PwC sets the limits for using reliefs. Wave 1 companies moving from ESRS (2023) do not have to restate prior-year figures for metrics whose definitions have changed, but they must provide comparatives for metrics that are unchanged (Question SRG 3-16). The “undue cost or effort” argument fails, in PwC’s view, if the data is already collected for other purposes, if no attempt was made to obtain it, if it is publicly available or cheap to obtain, or if the company simply “was not aware of the requirement” (Question SRG 5-4). In practice, that test will be applied to every reliance on estimates.
PwC’s HoldCo case (Example SRG 3-1) shows how the boundary works month by month when a group buys and sells during the year. The acquired entity (EP) contributes water consumption from May, and the disposed entity (MMI) up to October, giving a consolidated total of 134,720 m³.

Source: PwC, Sustainability reporting guide, Example SRG 3-1, p. 3-22.
EY vs PwC CSRD examples: same versus different
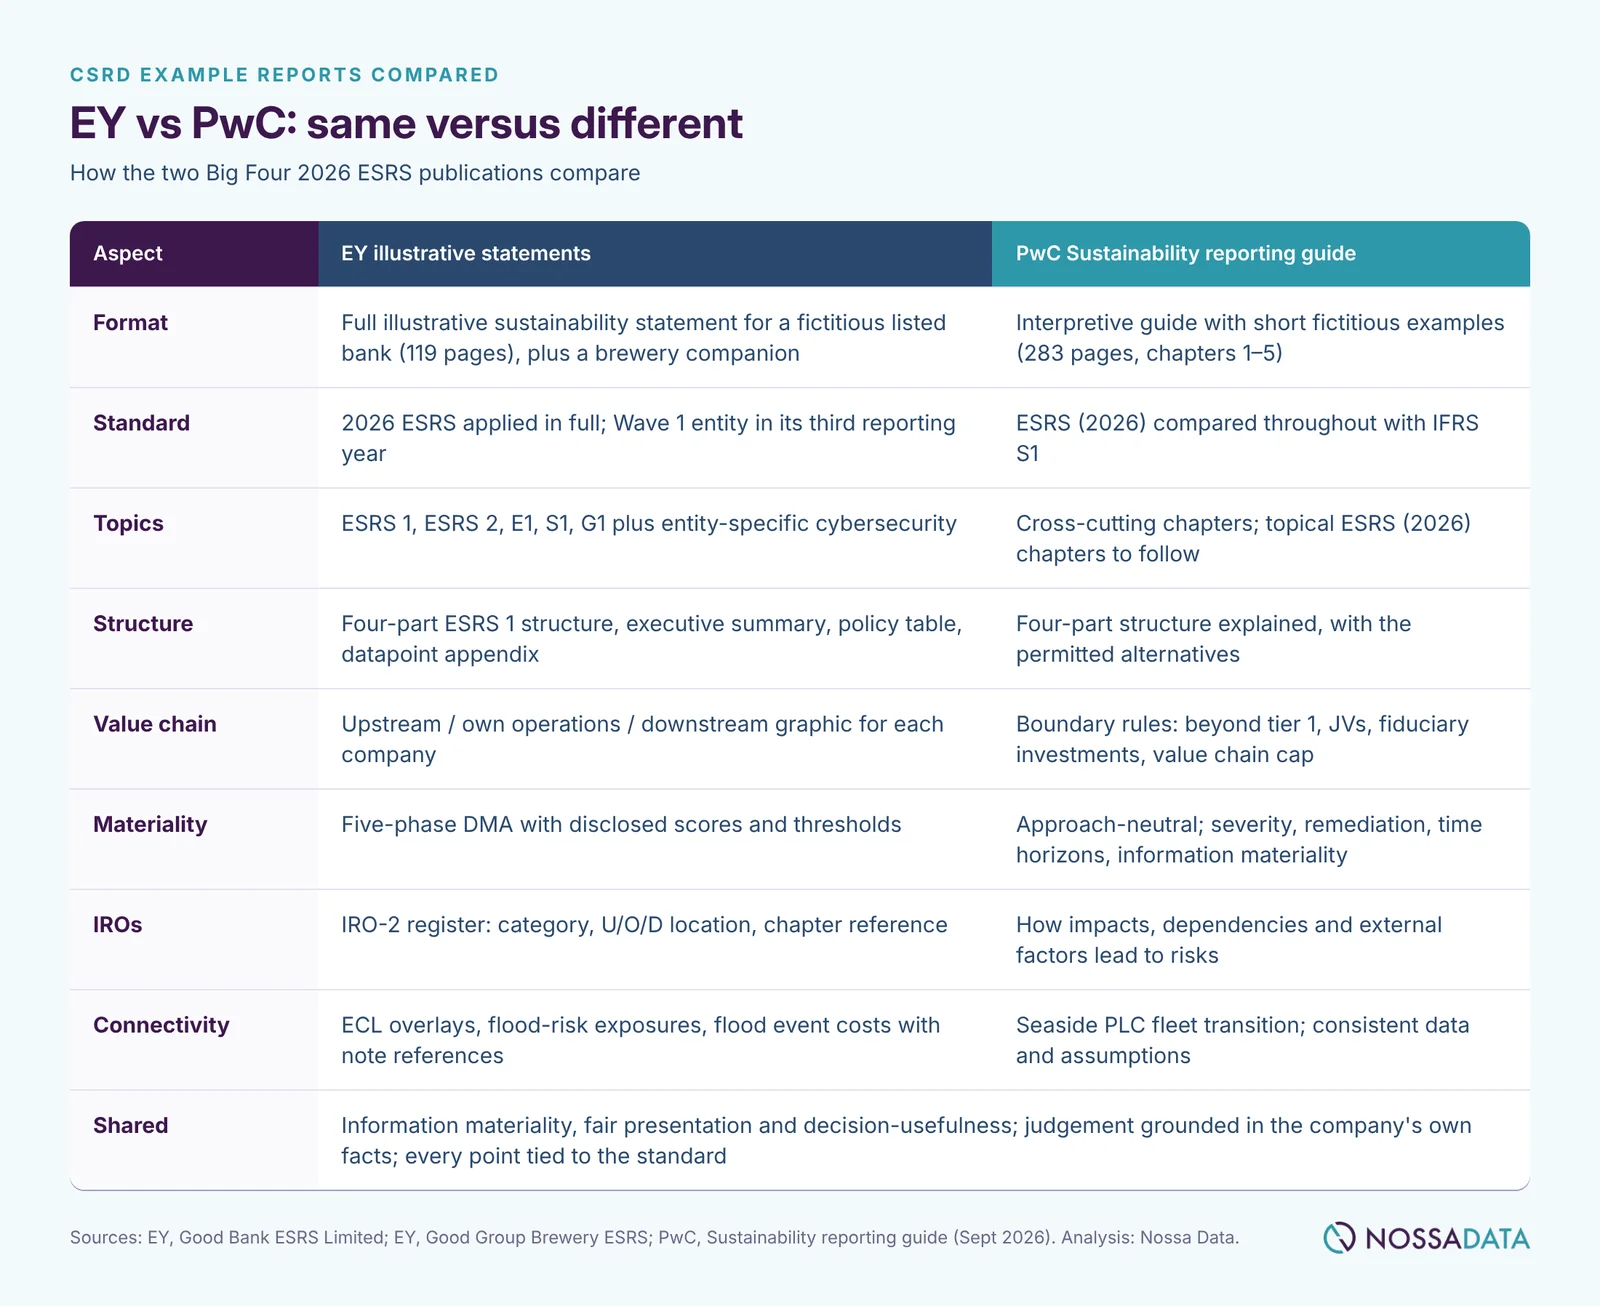
View as table
| Aspect | EY illustrative statements | PwC Sustainability reporting guide |
|---|---|---|
| Format | Full illustrative sustainability statement for a fictitious listed bank (119 pages), plus a brewery companion | Interpretive guide with short fictitious examples (283 pages, chapters 1–5) |
| Standard | 2026 ESRS applied in full; Wave 1 entity in its third reporting year | ESRS (2026) compared throughout with IFRS S1 |
| Topics | ESRS 1, ESRS 2, E1, S1, G1 plus entity-specific cybersecurity | Cross-cutting chapters; topical ESRS (2026) chapters to follow |
| Structure | Four-part ESRS 1 structure, executive summary, policy table, datapoint appendix | Four-part structure explained, with the permitted alternatives |
| Value chain | Upstream / own operations / downstream graphic for each company | Boundary rules: beyond tier 1, JVs, fiduciary investments, value chain cap |
| Materiality | Five-phase DMA with disclosed scores and thresholds | Approach-neutral; severity, remediation, time horizons, information materiality |
| IROs | IRO-2 register: category, U/O/D location, chapter reference | How impacts, dependencies and external factors lead to risks |
| Connectivity | ECL overlays, flood-risk exposures, flood event costs with note references | Seaside PLC fleet transition; consistent data and assumptions |
| Shared | Information materiality, fair presentation and decision-usefulness; judgement grounded in the company's own facts | Same |
Seven CSRD reporting lessons for listed companies
Both documents point to the same conclusion: the 2026 ESRS allow a shorter statement, provided every omission rests on a judgement you can document. EY’s foreword says the revised standards “encourage entities to focus on decision-useful information”, and warns against treating reporting “solely as a compliance exercise”. Seven practical points follow from reading the two side by side.
- Omit with a documented reason. EY leaves out S1-13, S1-14 and G1-6 completely because the DMA found no material IROs there. That is expected under the 2026 ESRS, but each omission needs a documented basis that will survive assurance.
- Disclose your DMA thresholds. EY sets out its scales, the 3:1 weighting, the thresholds of 3 and 12, and who can override a result. An assurance team can test that methodology. A heat map with no numbers will draw questions.
- Link the DMA to your risk framework. EY’s bank uses a single risk assessment for prudential reporting and for the ESRS. If your enterprise risk management and DMA use different scales or time horizons, someone will ask why.
- Map beyond tier 1, then let materiality set the boundary. Fabrics Corp shows why indirect suppliers cannot be ignored. The value chain cap from 2027 will limit what you can require from smaller partners, but it does not reduce what you need to assess.
- Present IROs as connected chains. Each impact should be followed through to the risk or opportunity it creates, and each IRO should be traceable to a strategic pillar, a policy and, where relevant, an amount in the financial statements.
- Use the same numbers as the financial statements. ECL overlays, impairments, capex and scenario assumptions should match the accounts, with note references, as in Seaside PLC’s fleet transition and Good Bank’s flood-risk tables.
- Disclose reliefs, revisions and errors in one place. A single BP-1 table covering revised estimates, restatements, acquisition reliefs and omissions makes the report easier to read and easier to audit.
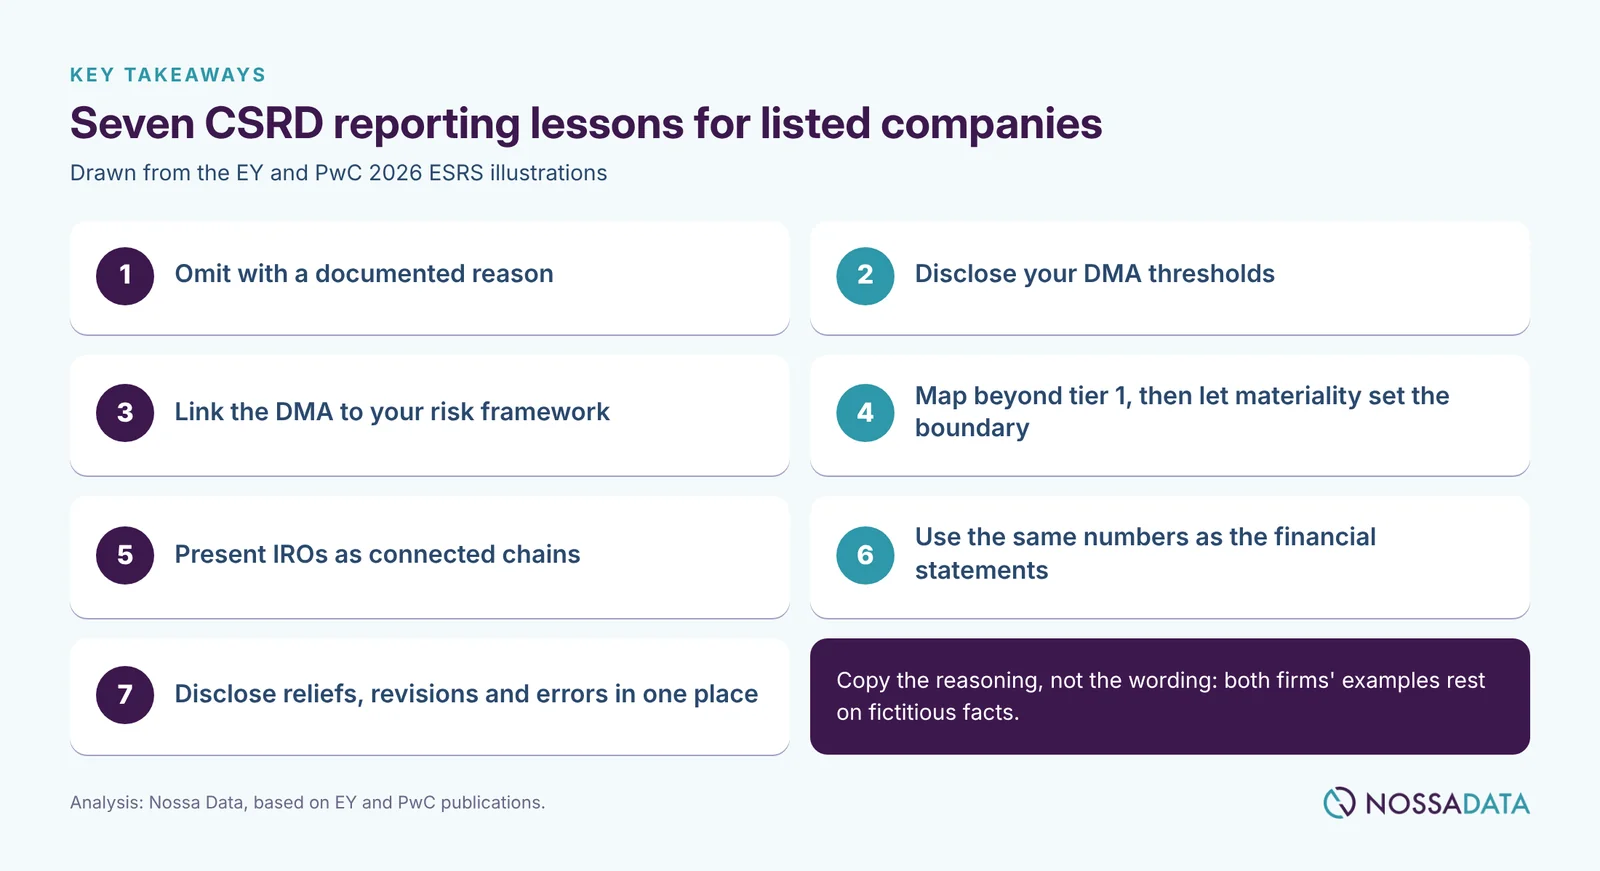
Both firms caution that their examples are built on fictitious facts and may be more detailed than a real report needs. The scoring thresholds and the IRO wording should not be copied as they stand. The useful part is the reasoning behind each choice. If your team can explain your own judgements at that level, you will be in a strong position for a limited-assurance review.
Sources
- EY, Good Bank ESRS Limited – Illustrative Sustainability Statement in accordance with 2026 ESRS (second edition, October 2026).
- EY, Good Group Brewery ESRS, illustrative sustainability statement for a non-financial company (2026 ESRS).
- PwC, Sustainability reporting guide, chapters 1–5 (as of September 2026).
This article summarises publicly available illustrative material for general information and does not constitute accounting, audit or legal advice.