
Interviews
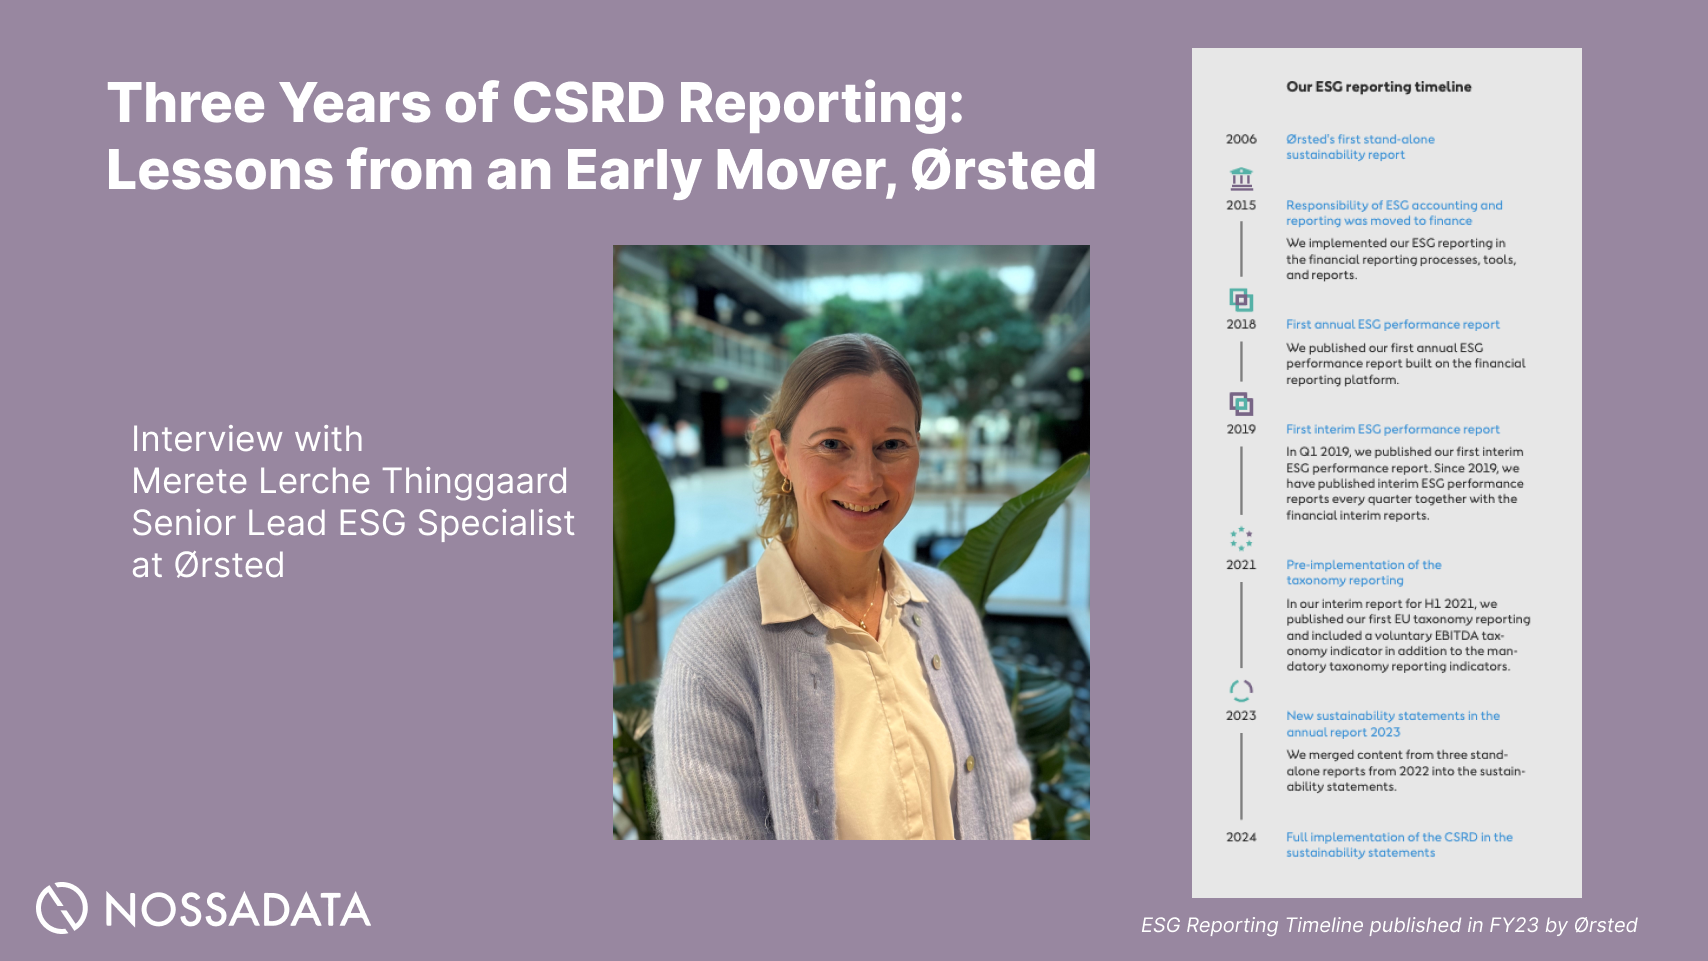
Three Years of CSRD Reporting: Lessons from an Early Mover, Ørsted
An expert interview with Merete Lerche Thinggaard, Senior Lead ESG Specialist at Ørsted, on three CSRD reporting cycles.
An in-depth CSRD reporting benchmark covering the FY2025 ESRS sustainability statements of the top 250 STOXX Europe 600 companies. We point out best-practice CSRD reports, ESRS material topic patterns by industry, quantitative sustainability metric comparisons, target-setting benchmarks, and the relationship between CDP climate scores and CSRD disclosure depth. This article also offers a practical guide for wave-2 CSRD issuers, ESG analysts and sustainability reporting teams.
The first full wave of CSRD reporting has now passed, and the European sustainability disclosure landscape has shifted from speculative CSRD preparation into a market of real, audited ESRS sustainability statements. Hundreds of large-cap European issuers filed their first fully ESRS-compliant sustainability statements covering fiscal year 2024, and the second wave — companies meeting the CSRD size thresholds one year later — is already approaching the same reporting deadline.
Before the second wave closes its double materiality assessments and commits to sustainability targets in print, there is significant value in understanding how the first wave actually handled ESRS reporting in practice: which topics large European companies deemed material, what level of granularity their quantitative ESG disclosures reached, the shape of the climate and sustainability targets they committed to, and how their CSRD-aligned narrative compared against independent third-party benchmarks such as CDP climate scores.
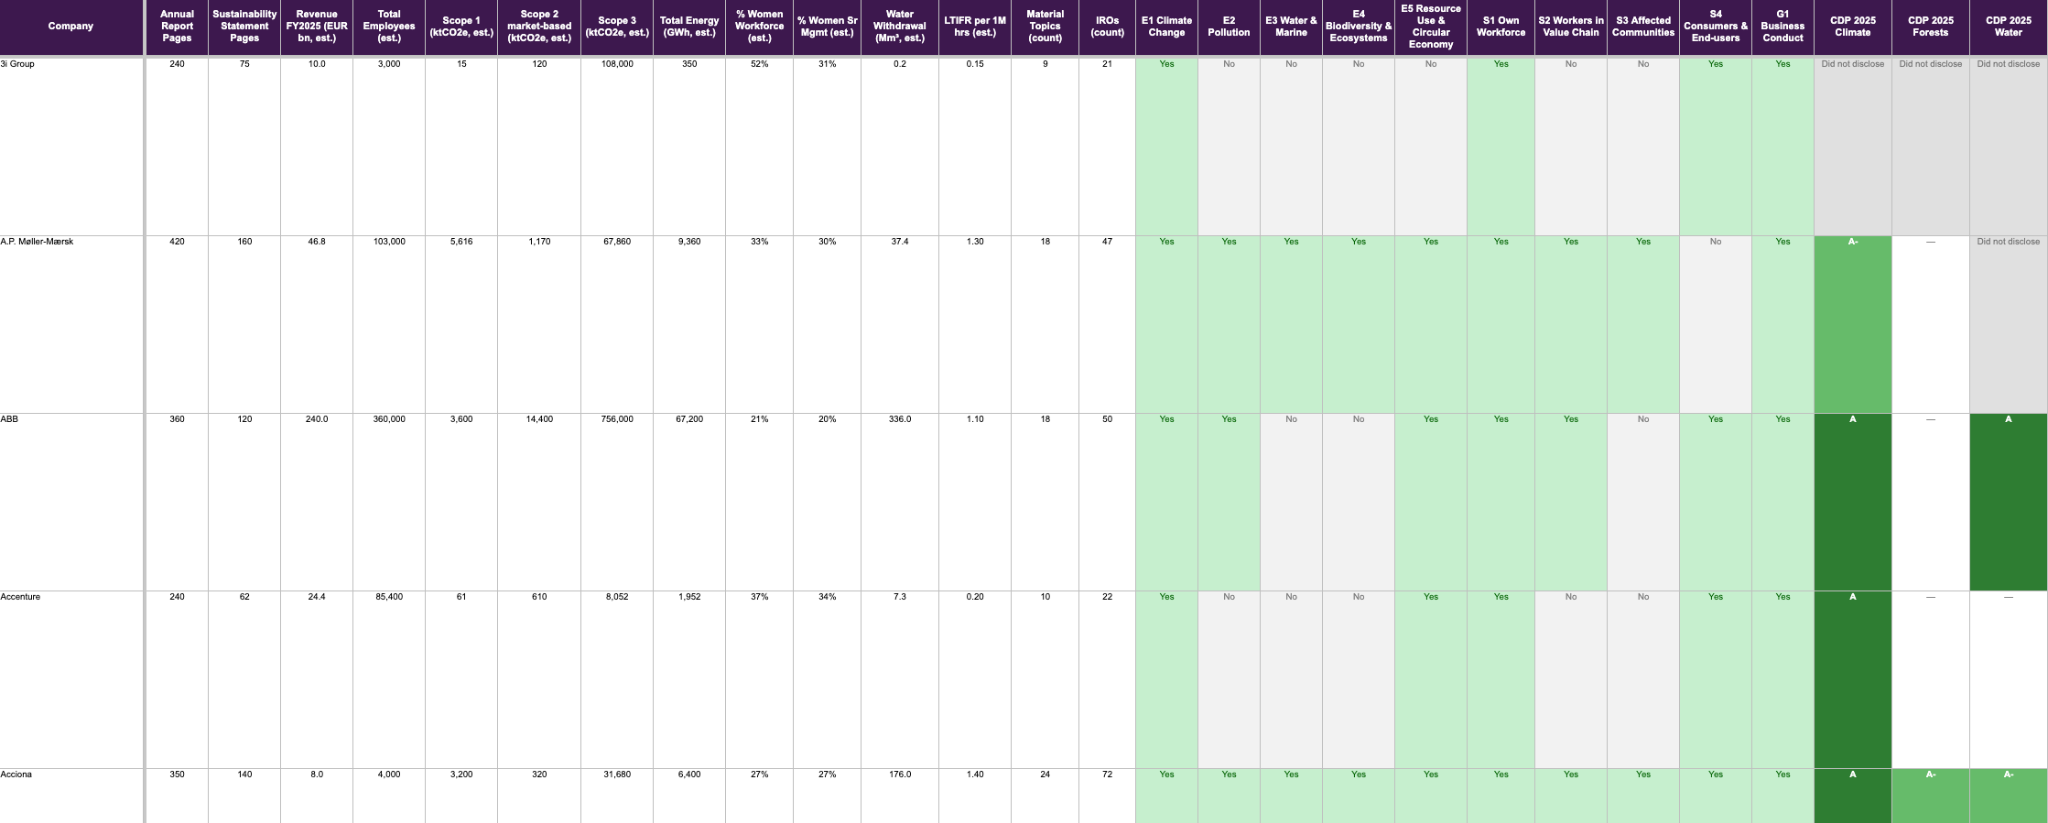
Against that backdrop, Nossa Data used AI to help to conduct a systematic CSRD benchmarking review of the FY2025 reports of the top 250 STOXX Europe 600 companies by market capitalisation — spanning EU-domiciled CSRD-mandated issuers, UK-domiciled voluntary ESRS aligners, Swiss-domiciled companies that are not in direct CSRD scope but align voluntarily, and Irish-domiciled inversions whose parent-level reporting sits outside CSRD but whose EU subsidiaries fall within it. The result is a single comparable CSRD dataset across 37+ dimensions of each company's sustainability disclosure — from Scope 1, 2 and 3 emissions and material ESRS topics through to IROs, CDP scores and target-setting language.
Across the 250-company cohort, we captured 37 dimensions of disclosure per company, structured into five data layers. The first layer is company identity and reporting mechanics: ticker, market capitalisation (EUR billions), region, sector, fiscal-year end, the specific report year used (FY2025 wherever available, falling back to the most recent prior year for a small number of non-calendar fiscal-year companies), a verified link to the report, and page counts for both the overall Annual Report and the Sustainability Statement section.
The second layer captures 10 quantitative CSRD metrics — Revenue, Total Employees, Scope 1 / Scope 2 market-based / Scope 3 emissions, Total Energy Consumption, % Women in Workforce, % Women in Senior Management, Water Withdrawal, and Lost-Time Injury Frequency Rate — the ten data points most universally disclosed under ESRS across the cohort. The third layer captures the double-materiality assessment: whether each of the ten ESRS topical standards (E1 Climate, E2 Pollution, E3 Water, E4 Biodiversity, E5 Circular, S1 Own Workforce, S2 Value-Chain Workers, S3 Affected Communities, S4 Consumers, G1 Business Conduct) was deemed material, plus the total counts of material topics and IROs.
The fourth layer is third-party validation: CDP 2025 scores across Climate, Forests and Water themes, extracted directly from CDP's public 2025 Corporate A List and Public Corporate Scores databases and matched against our 250 companies with per-company verification. The fifth and final layer is targets: ten topic-aligned target columns covering climate/net-zero, Scope 3, energy/renewables, water, circular/waste, biodiversity, health & safety, diversity & inclusion, training, and human rights / supply chain; plus an overall narrative summary and a source-with-page-reference column pointing readers to the MDR-T target tables in each report.
Want the full excel? Contact solutions@nossadata.com - anyone listed company who books a 15 minute intro call will get an analysis of how their company’s data compares to the cohort and the raw data after the call.
• 37 columns × 250 European companies: identity, quantitative metrics, material topics, CDP scores, target summaries, source references
• We'll walk you through the structure and answer your questions about CSRD reporting, wave-2 preparation, or how the benchmarking can support your own disclosure work
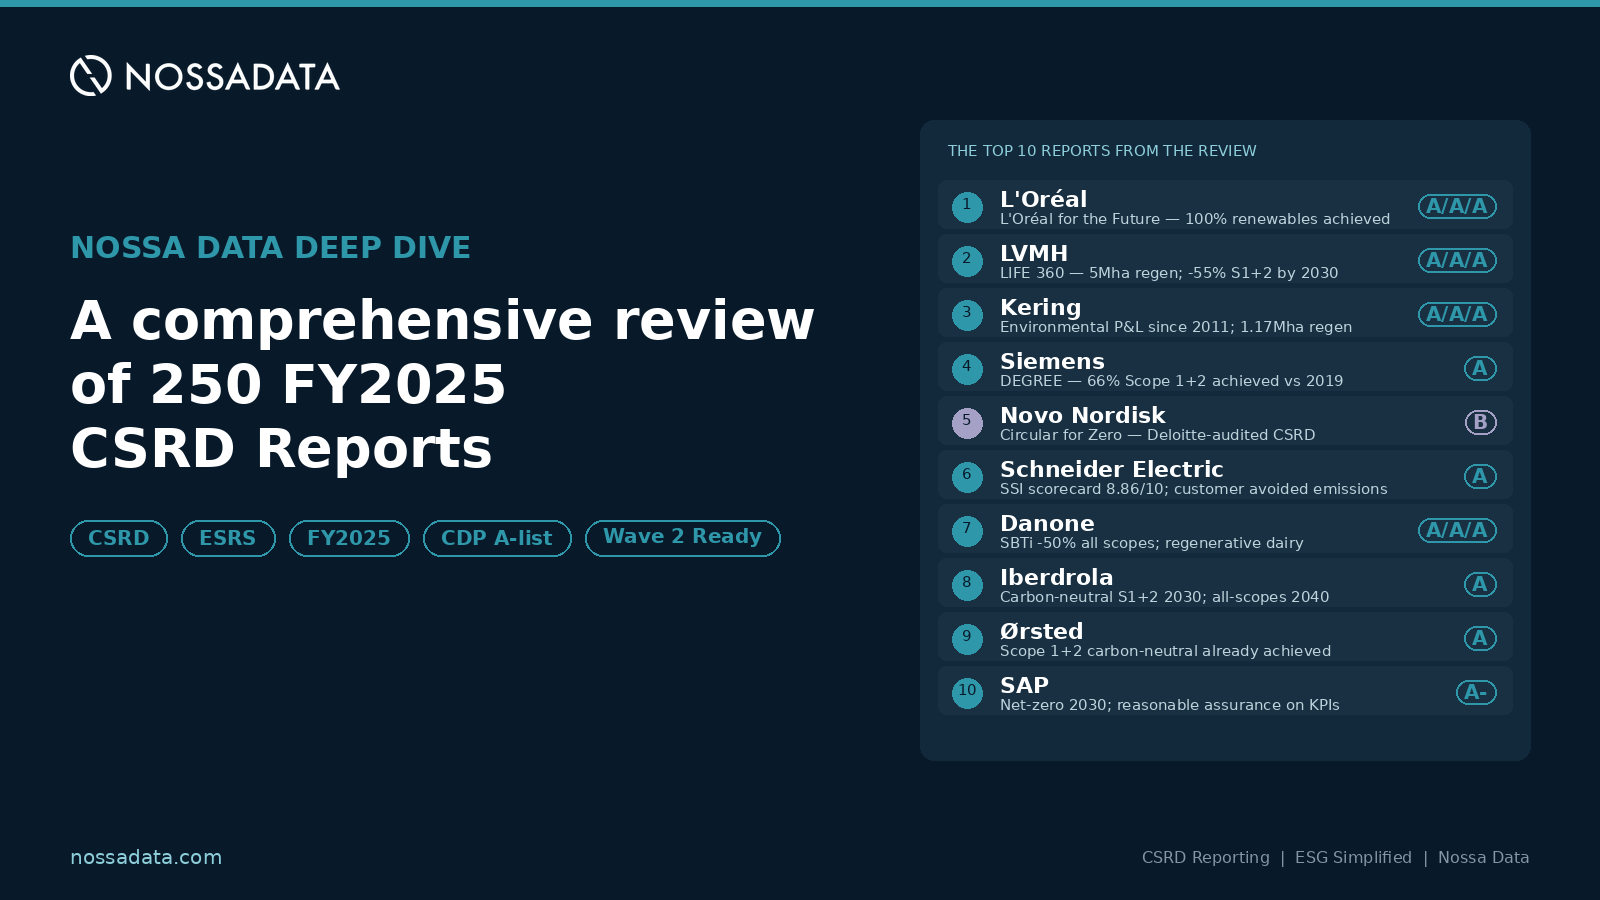
In assessing the strongest reports across the 250, we weighted four factors: ESRS-compliance depth (including breadth of material-topic disclosure and rigour of double-materiality methodology), audit assurance level (reasonable versus limited assurance), target rigour (SBTi validation, named programmes with interim dates, and transparent progress reporting including setbacks), and independent third-party validation (CDP scores, TNFD alignment, external verification). The ten below represent what we believe is best-practice first-wave CSRD reporting, from which second-wave and less-mature first-wave issuers can most productively learn.
A note on the visuals: for all ten companies below, the screenshots are genuine page-level extracts from each company's FY2025 sustainability statement, with the source page number cited in the caption beneath each image. Each screenshot has been selected to highlight a specific element of best practice that we believe second-wave and less-mature first-wave issuers can productively learn from.
1. L'Oréal · FY2025 Report
Best practice: Most mature large-company sustainability framework in Europe, with measurable 2030 commitments and several already achieved. CDP Triple A.
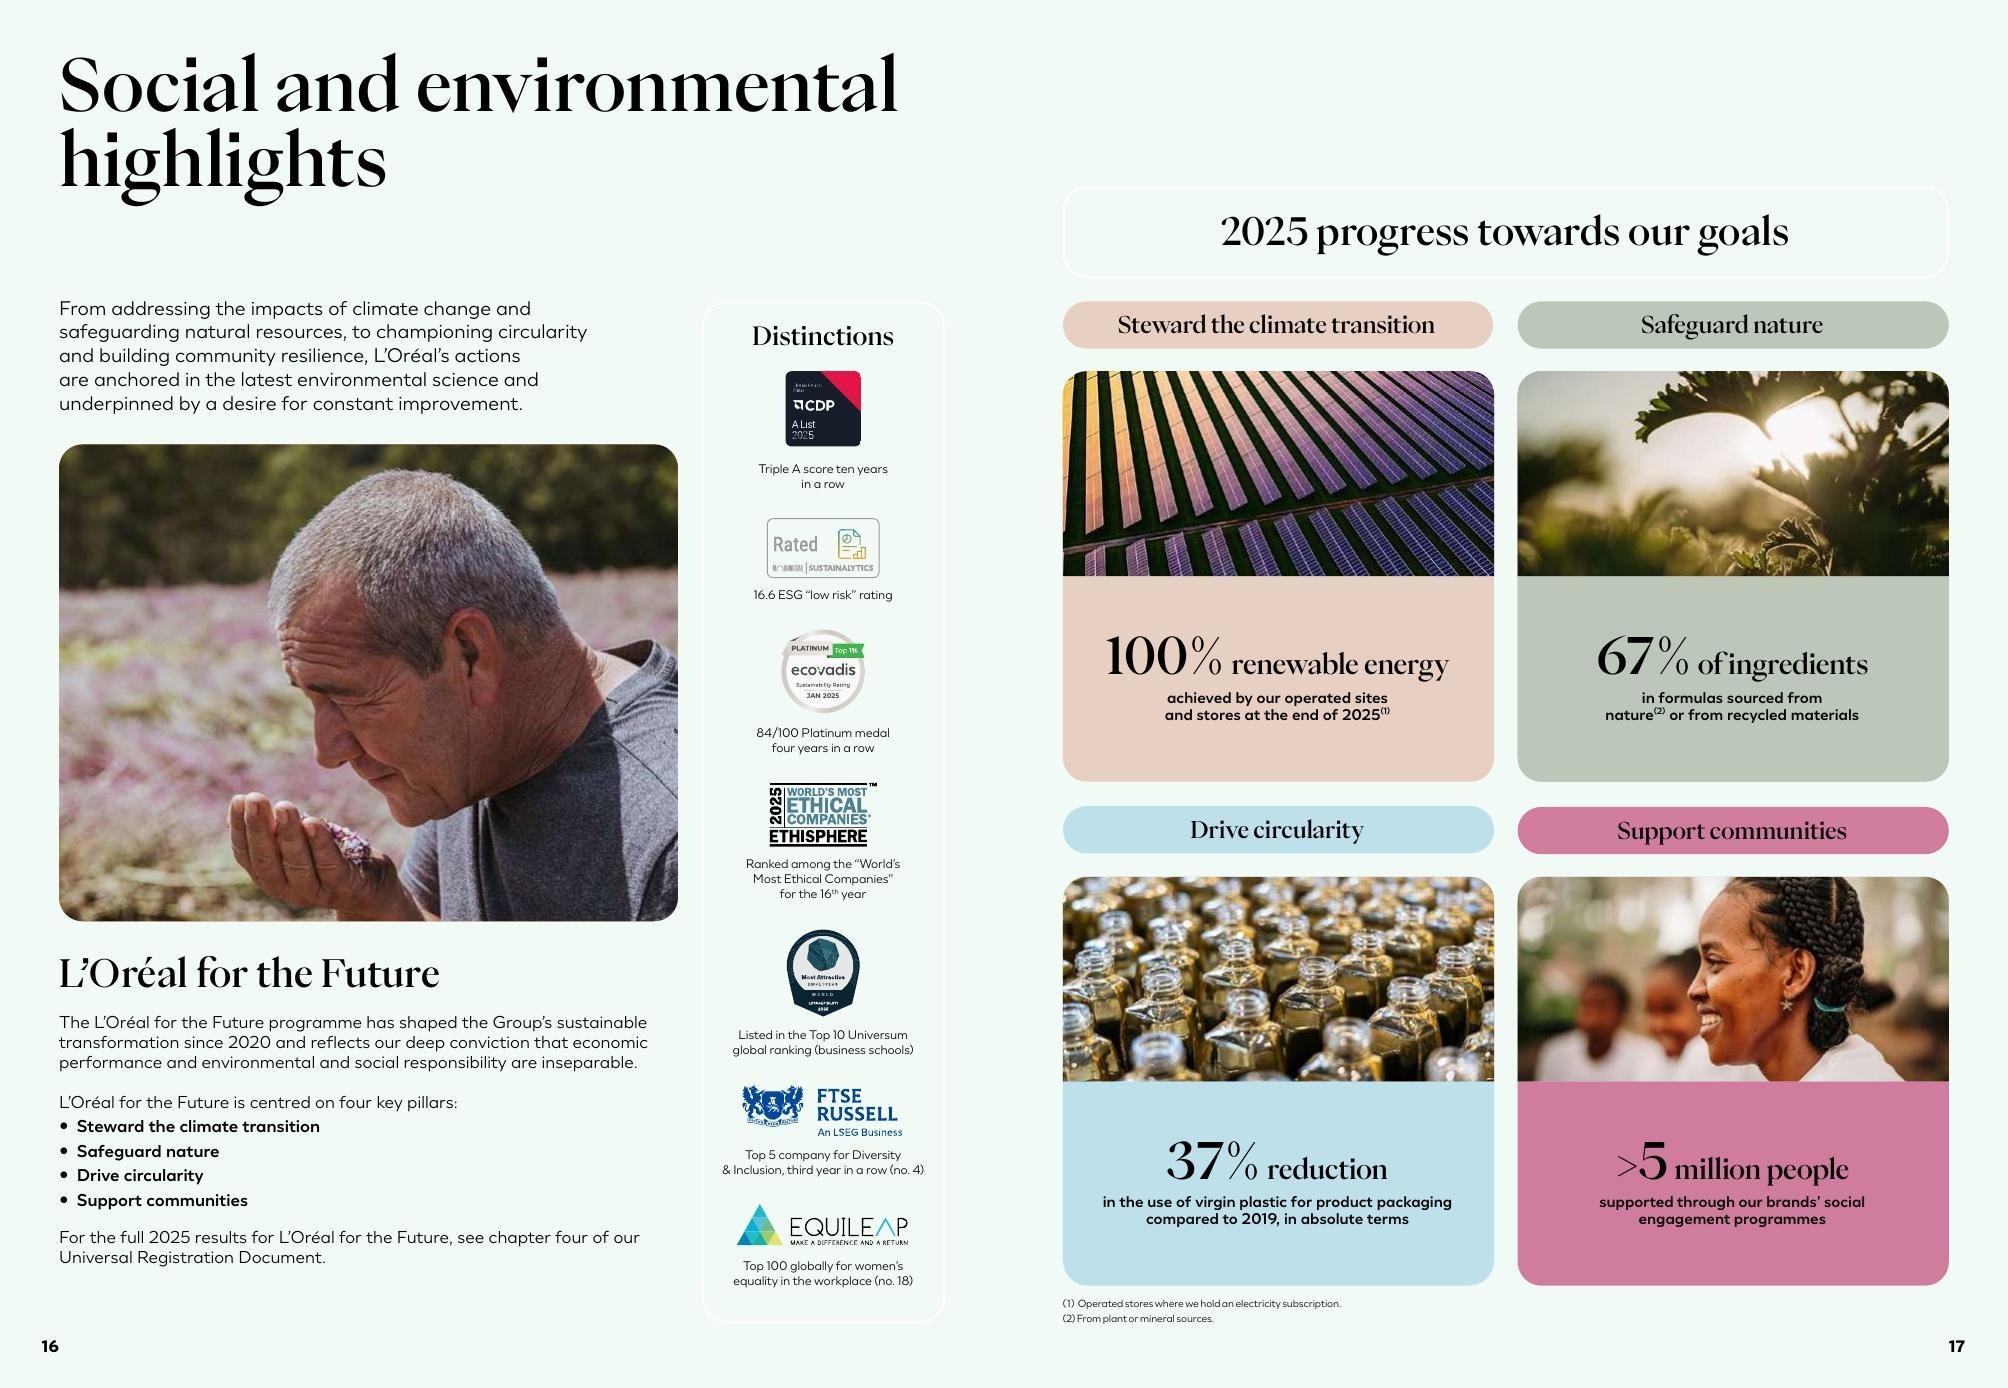
L'Oréal Annual Report 2025, pp. 16-17 — Social and environmental highlights dashboard showing 2025 progress against L'Oréal for the Future goals: 100% renewable energy achieved, 67% of ingredients sustainably sourced, 37% virgin plastic reduction, 5 million+ people supported, CDP Triple A for 10 years in a row, and a 16.6 ESG low-risk rating.
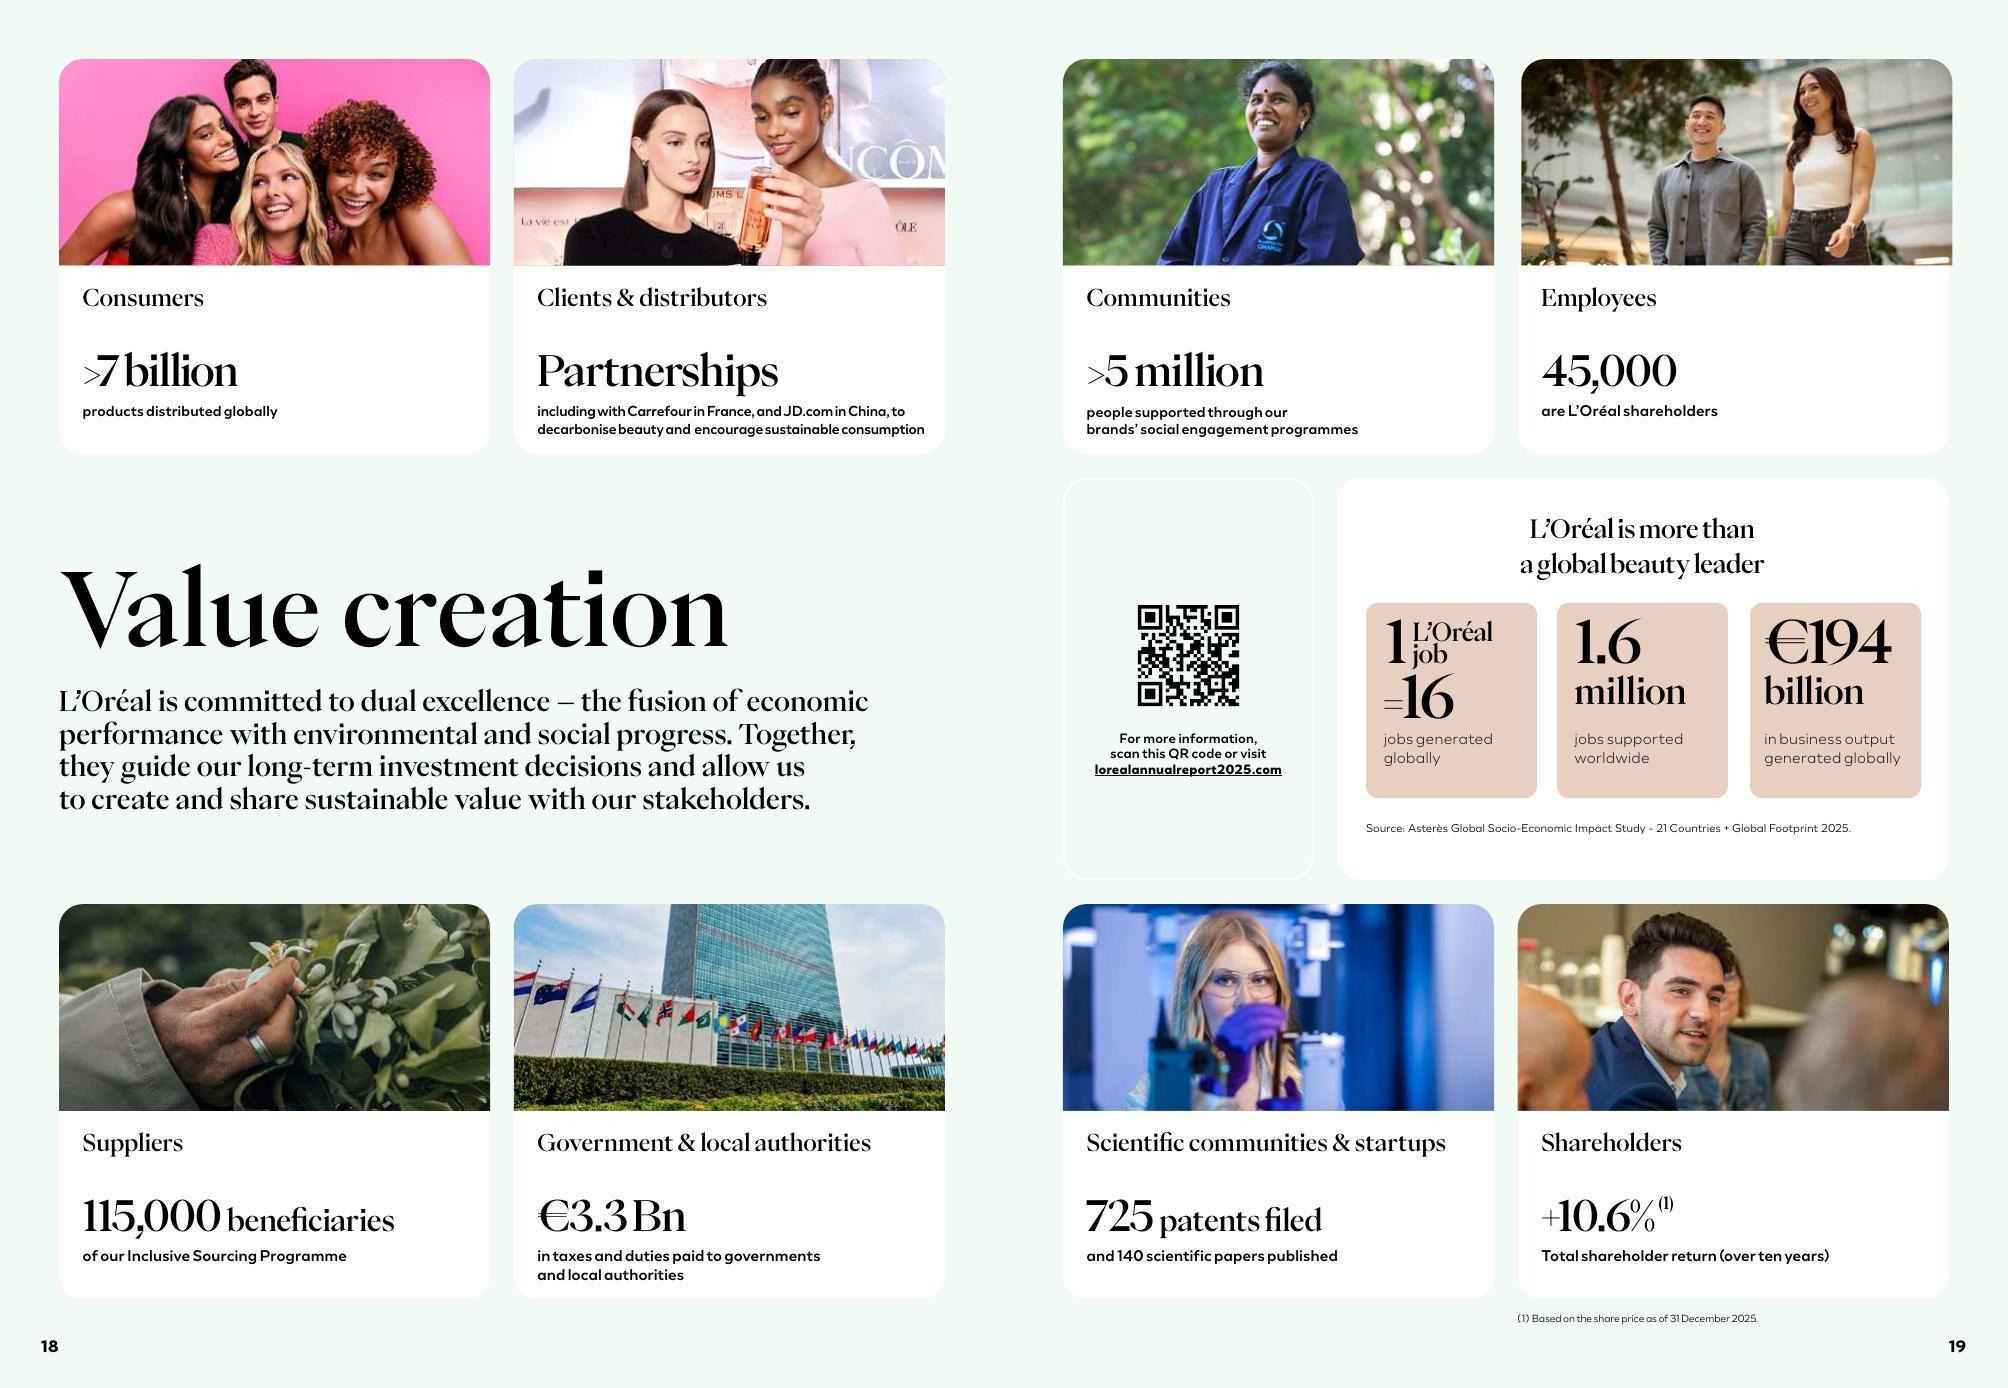
L'Oréal Annual Report 2025, p. 18 — Continued highlights of L'Oréal for the Future across the Group's four divisions, with named commitments per pillar (Steward the climate transition / Safeguard nature / Drive circularity / Support communities).
2. LVMH · FY2025 Report
Best practice: Single LIFE 360 programme applied consistently across 75+ Maisons covering climate, biodiversity, circularity and traceability — rare coherence at this scale.
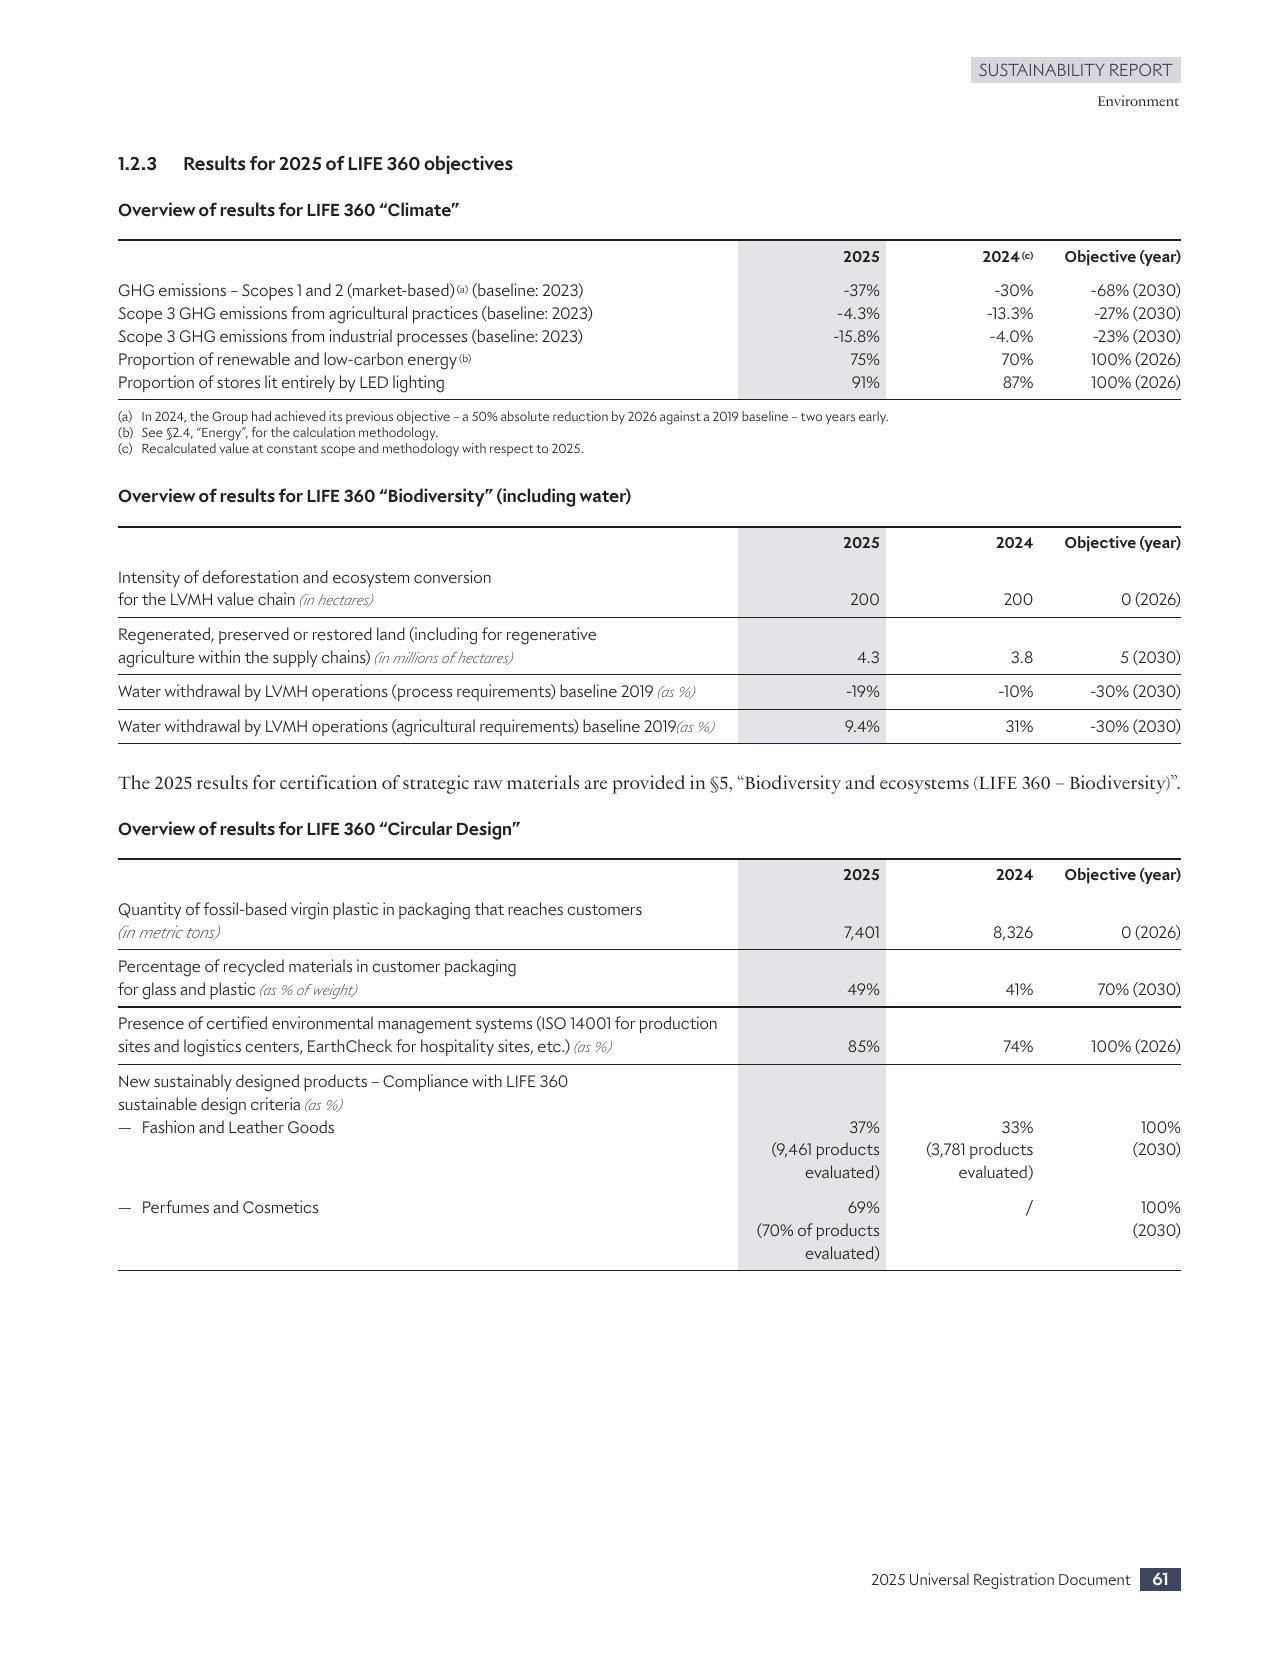
LVMH 2025 URD, p. 63 — Comprehensive LIFE 360 results table across three pillars (Climate, Biodiversity including Water, Circular Design) with 2024 and 2025 progress against explicit 2026-2030 objectives: GHG Scope 1+2 -37% (target -68% by 2030), Regenerated land 4.3M hectares (target 5M), Water withdrawal -19% (target -30%), Recycled packaging 49% (target 70%). The level of quantitative target-versus-progress disclosure is exceptional.
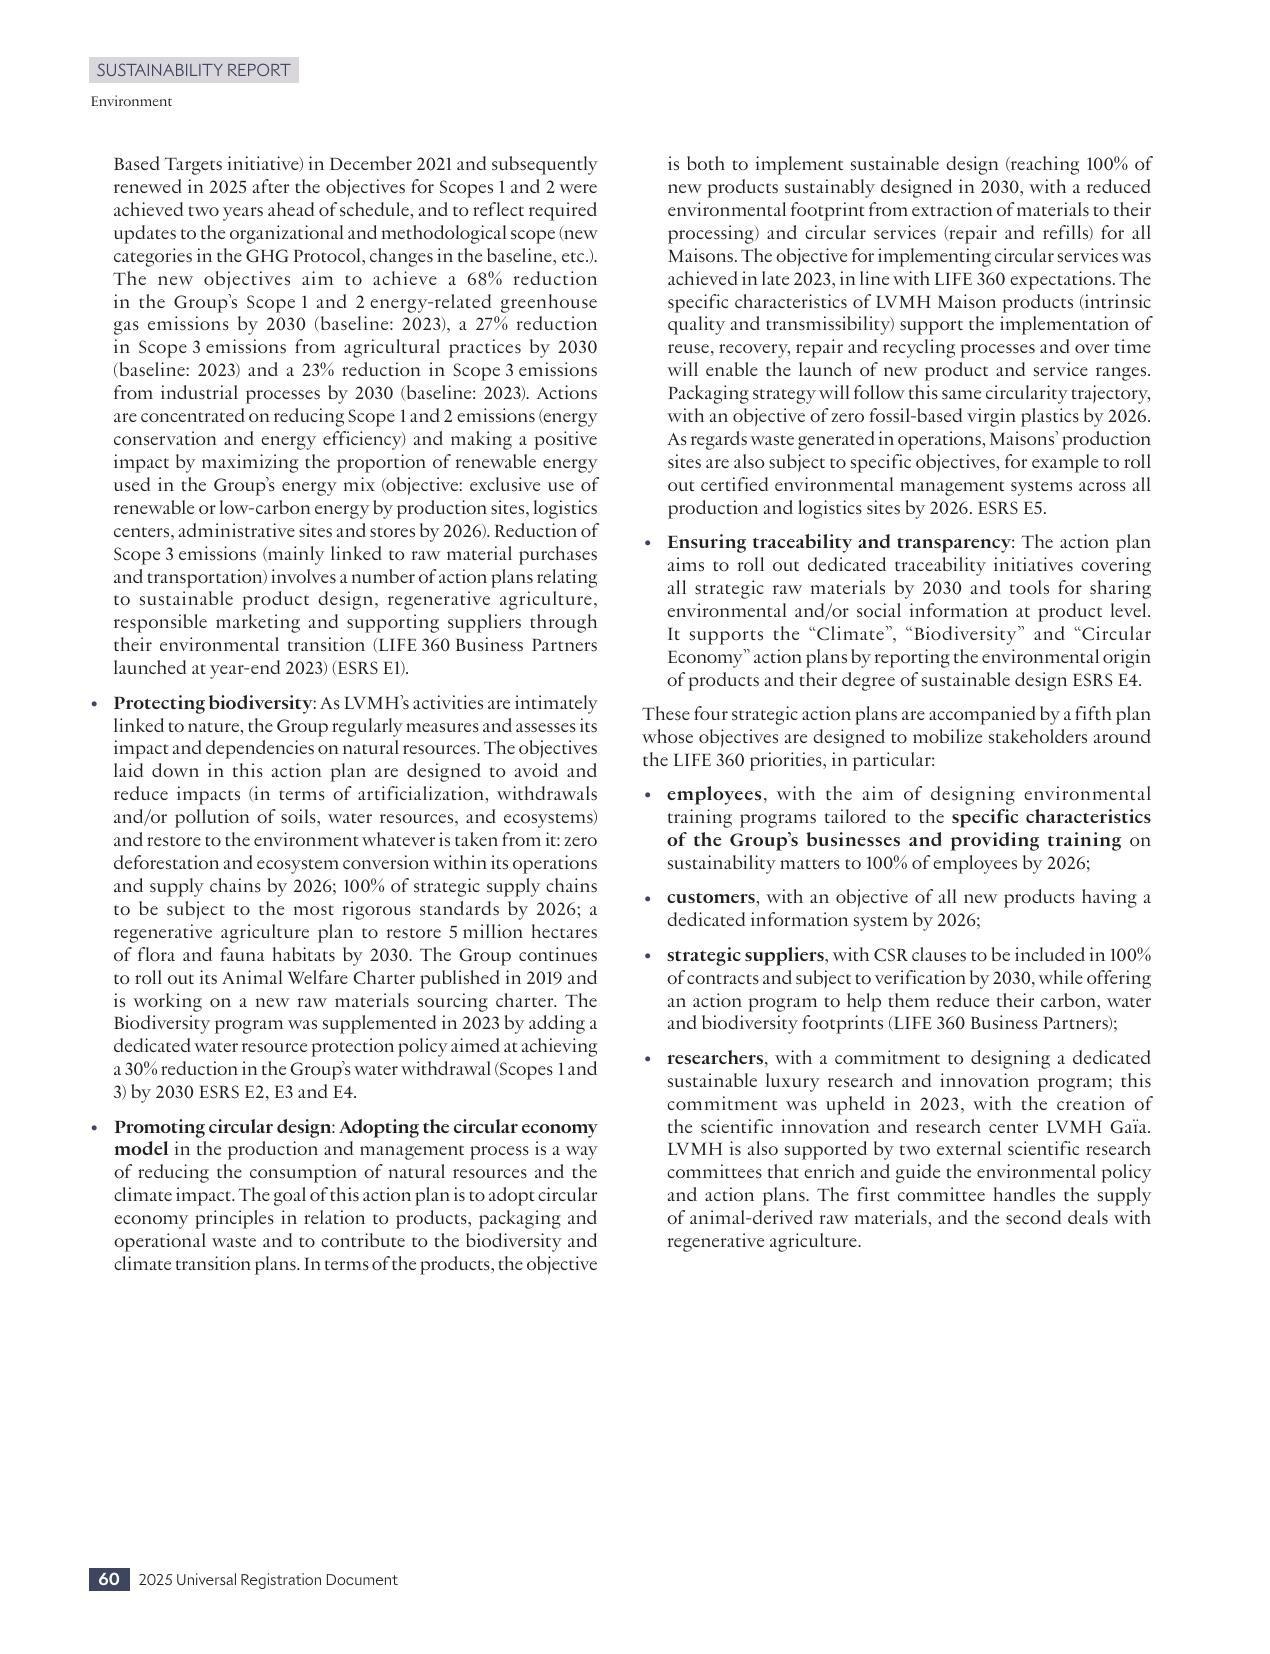
LVMH 2025 URD, p. 62 — Climate transition plan narrative: SBTi re-certified in 2025 after Scope 1+2 targets were achieved TWO years ahead of schedule, enabling recalibrated targets of -68% Scope 1+2, -27% Scope 3 agricultural, and -23% Scope 3 industrial by 2030. Also announces 5 million hectares of flora and fauna habitats to be restored by 2030 via Animal Welfare Charter and related initiatives.
3. Kering · FY2025 Report
Why Kering is best practice (one sentence): Kering is best practice because its 2025 URD pairs an unusually granular SBTN-validated nature targets table — including 1,179,956 hectares of regenerative farmland, which has already exceeded the 1,000,000-hectare 2025 target — with per-topic ESRS factsheets that collapse materiality, strategy, actions and quantified KPIs into single readable pages, and a distinctive EP&L-backed monitoring system that ties each target to a monetised natural-capital methodology Kering has maintained since 2011.
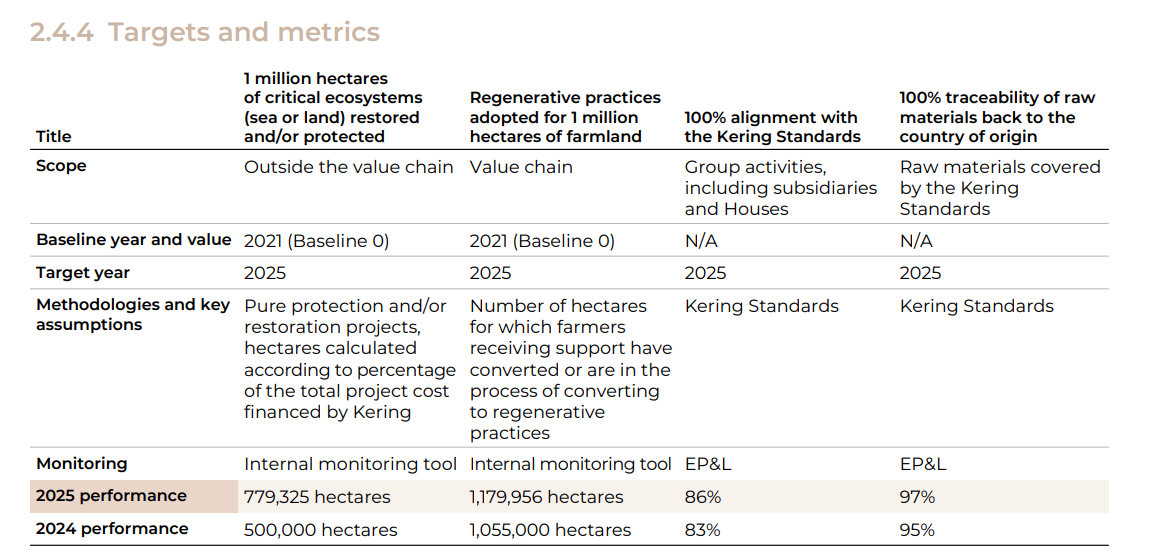
Kering 2025 URD, p. 227 — the 2.4.4 Targets and metrics table for biodiversity and ecosystems, disclosing four distinct nature targets (ecosystem restoration outside the value chain; regenerative farmland within the value chain; 100% Kering Standards alignment; 100% traceability to country of origin) with full columns for Scope, Baseline year, Target year, Methodology, Monitoring tool (EP&L for two of the four), plus explicit 2024 performance and 2025 performance rows. Striking quantitative honesty runs through every cell: the 1,000,000-hectare regenerative-farmland target has already been exceeded at 1,179,956 hectares, Kering Standards alignment has risen from 83% to 86%, and traceability from 95% to 97%; at the same time, Kering openly discloses that its 1,000,000-hectare ecosystem-restoration target will not be reached by year-end 2025 (at 779,325 hectares) and commits to continuing beyond the original target date. Target-exceeded, target-on-track, target-missed — disclosed side by side in a single table — is what genuine MDR-T best practice looks like.
4. Siemens · FY2025 Report
Best practice: First CSRD-compliant audited Sustainability Statement, high-quality first outing. DEGREE framework tracks 14 targets quantitatively with honest progress-to-date disclosure.
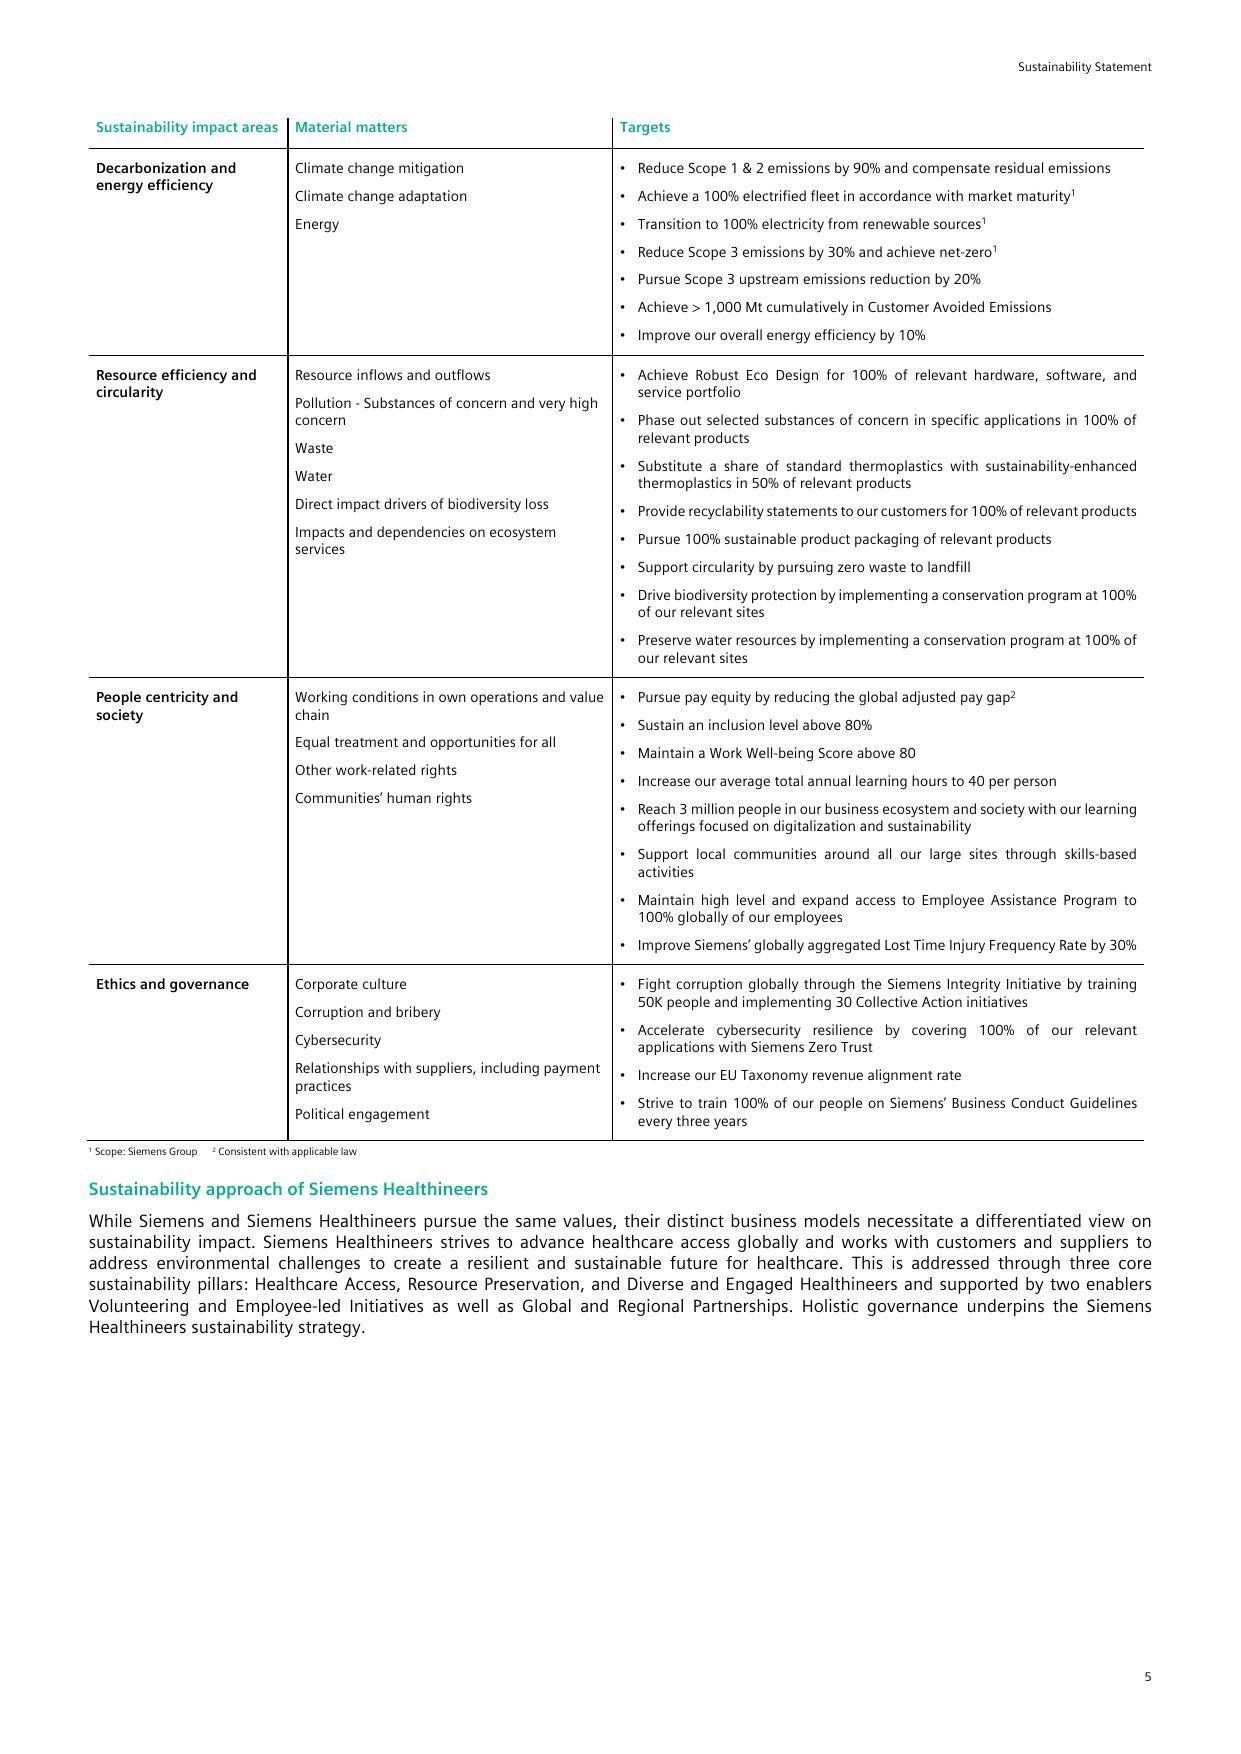
Siemens Report FY2025, p. 148 — Comprehensive DEGREE target matrix organised by sustainability impact area (Decarbonization, Resource Efficiency, People Centricity, Ethics & Governance), material matter and quantified target, covering Scope 1+2 -90%, 100% renewable electricity, Scope 3 -30%, and 1,000 Mt cumulative customer avoided emissions.
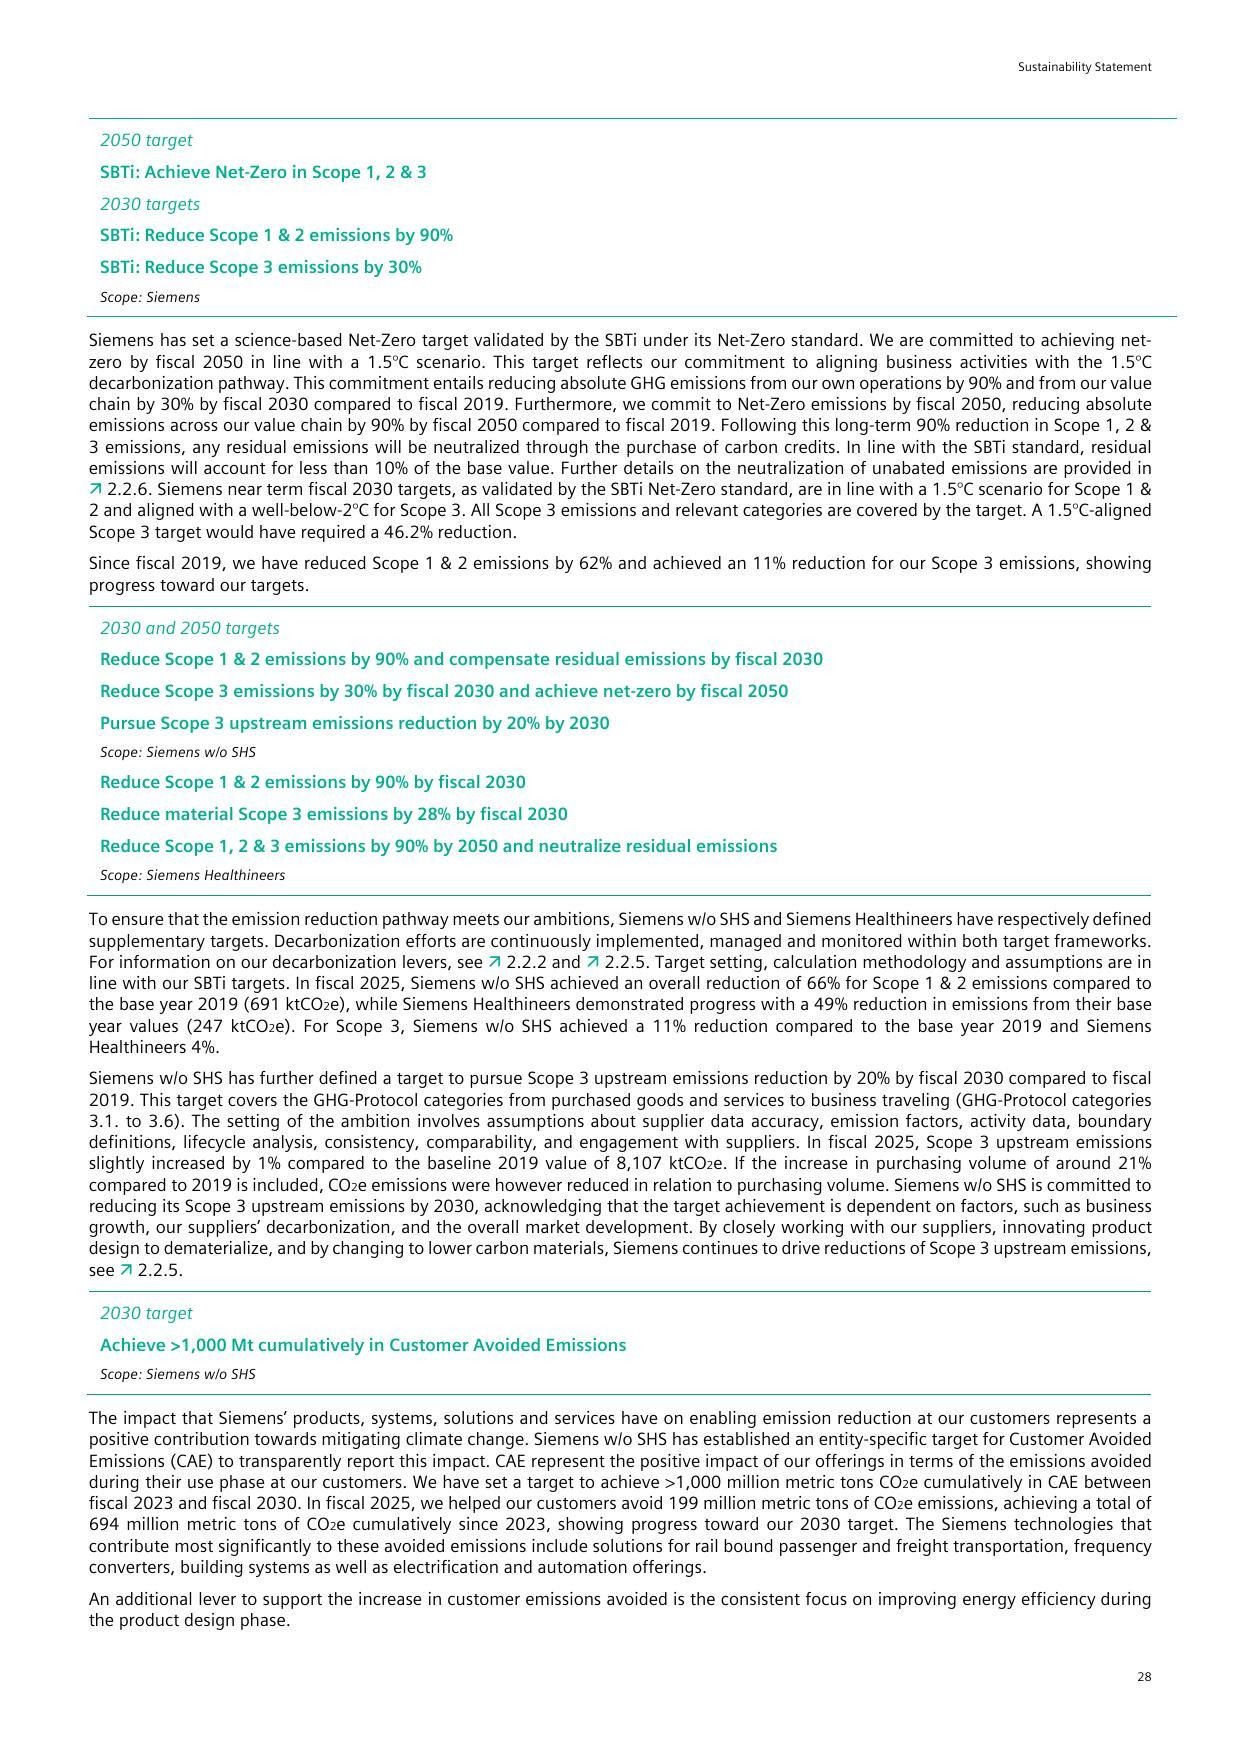
Siemens Report FY2025, p. 171 — SBTi Net-Zero targets with transparent progress-to-date disclosure: 'Since fiscal 2019, we have reduced Scope 1 & 2 emissions by 62% and achieved an 11% reduction for our Scope 3 emissions'; FY2025 achieved 66% reduction for Scope 1+2. This level of progress-versus-target honesty is a hallmark of best practice.
5. Novo Nordisk · FY2025 Report
Best practice: First pharma Annual Report in full CSRD compliance (FY2024), audited by Deloitte. Integrated financial-sustainability reporting with transparent Scope 3 methodology restatement.
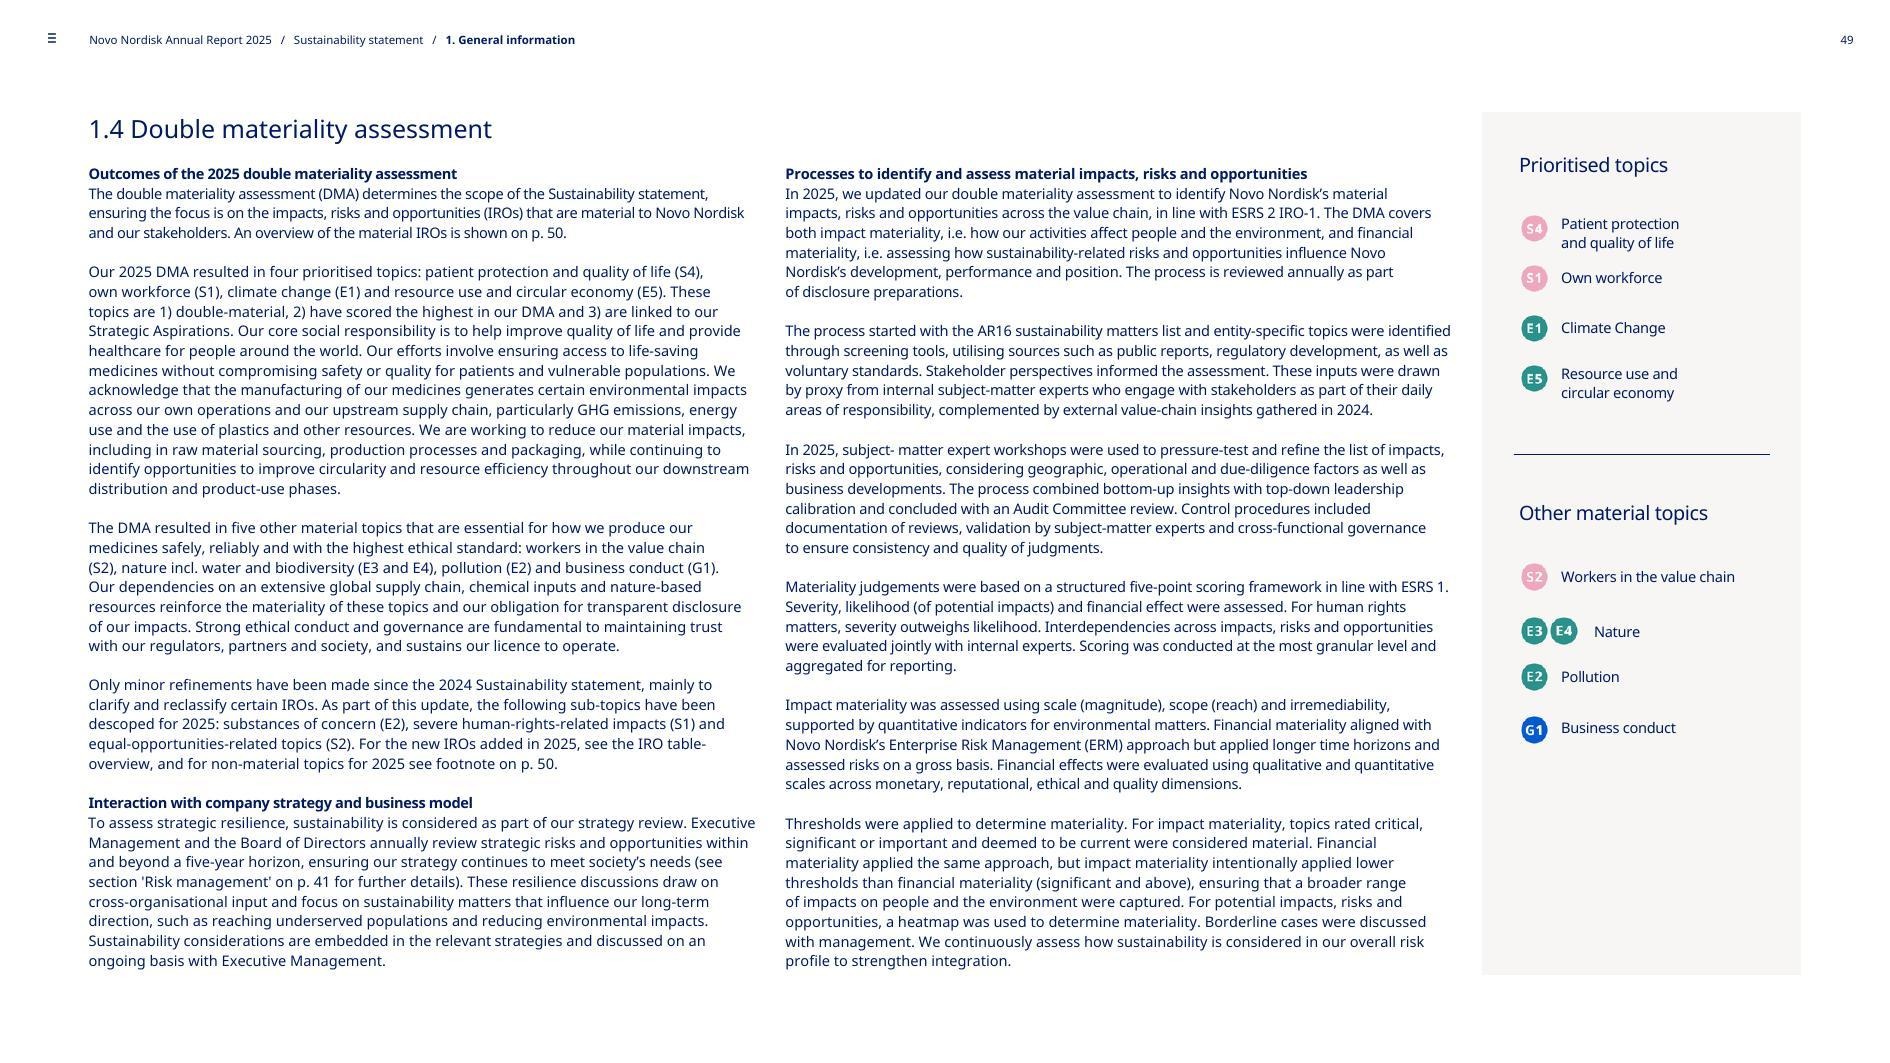
Novo Nordisk Annual Report 2025, p. 49 — Double Materiality Assessment disclosure explaining the DMA process, with prioritised topics (S4 Patient protection, S1 Own workforce, E1 Climate Change, E5 Resource use) and other material topics (S2 Workers in value chain, E3 Water, E2 Pollution, G1 Business conduct) presented against ESRS codes with explanation of methodology.
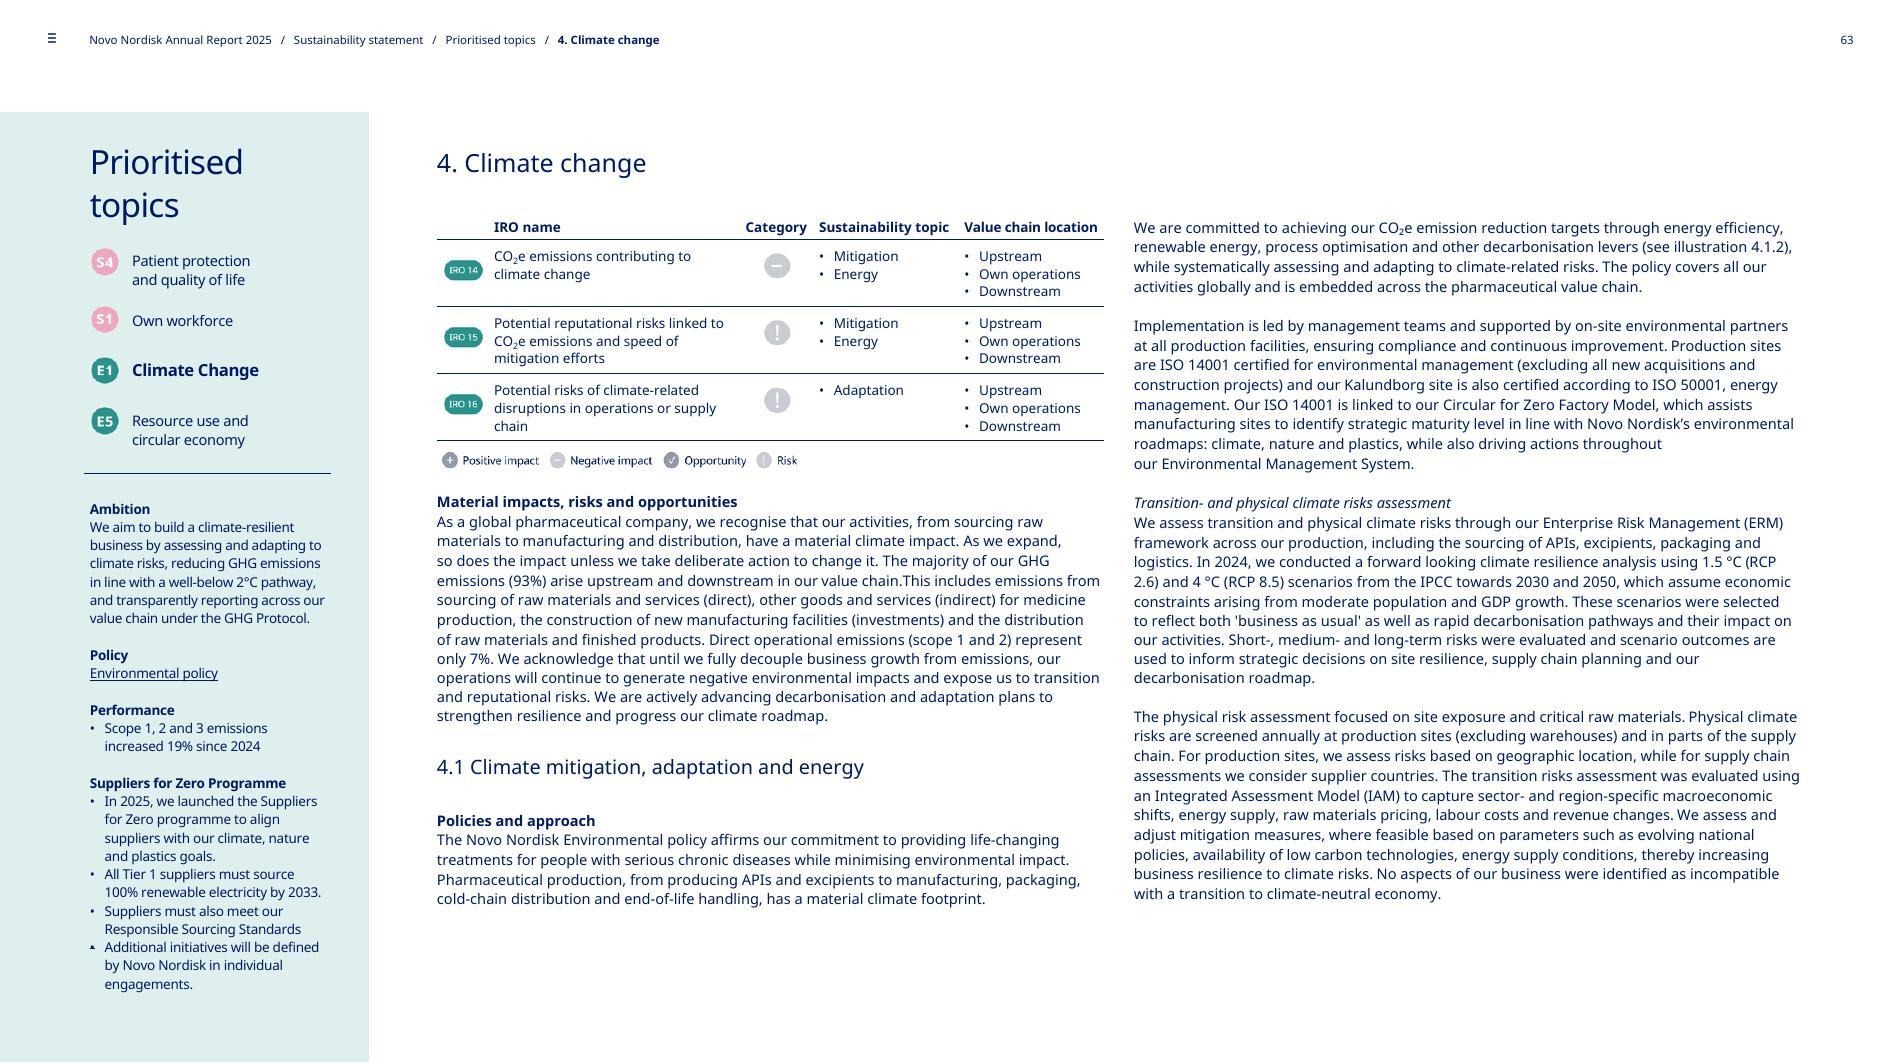
Novo Nordisk Annual Report 2025, p. 63 — Climate change chapter showing IRO name, category, sustainability topic and value-chain location for each impact; explicit performance disclosure including Scope 1-3 emissions progress and the launch of the 'Suppliers for Zero Programme' to align Tier-1 suppliers with 100% renewable electricity by 2033.
6. Schneider Electric · FY2025 Report
Best practice: Schneider Sustainability Impact scorecard with quarterly progress-versus-plan tracking on 11 targets. Distinctive customer-enabled avoided-emissions metric.
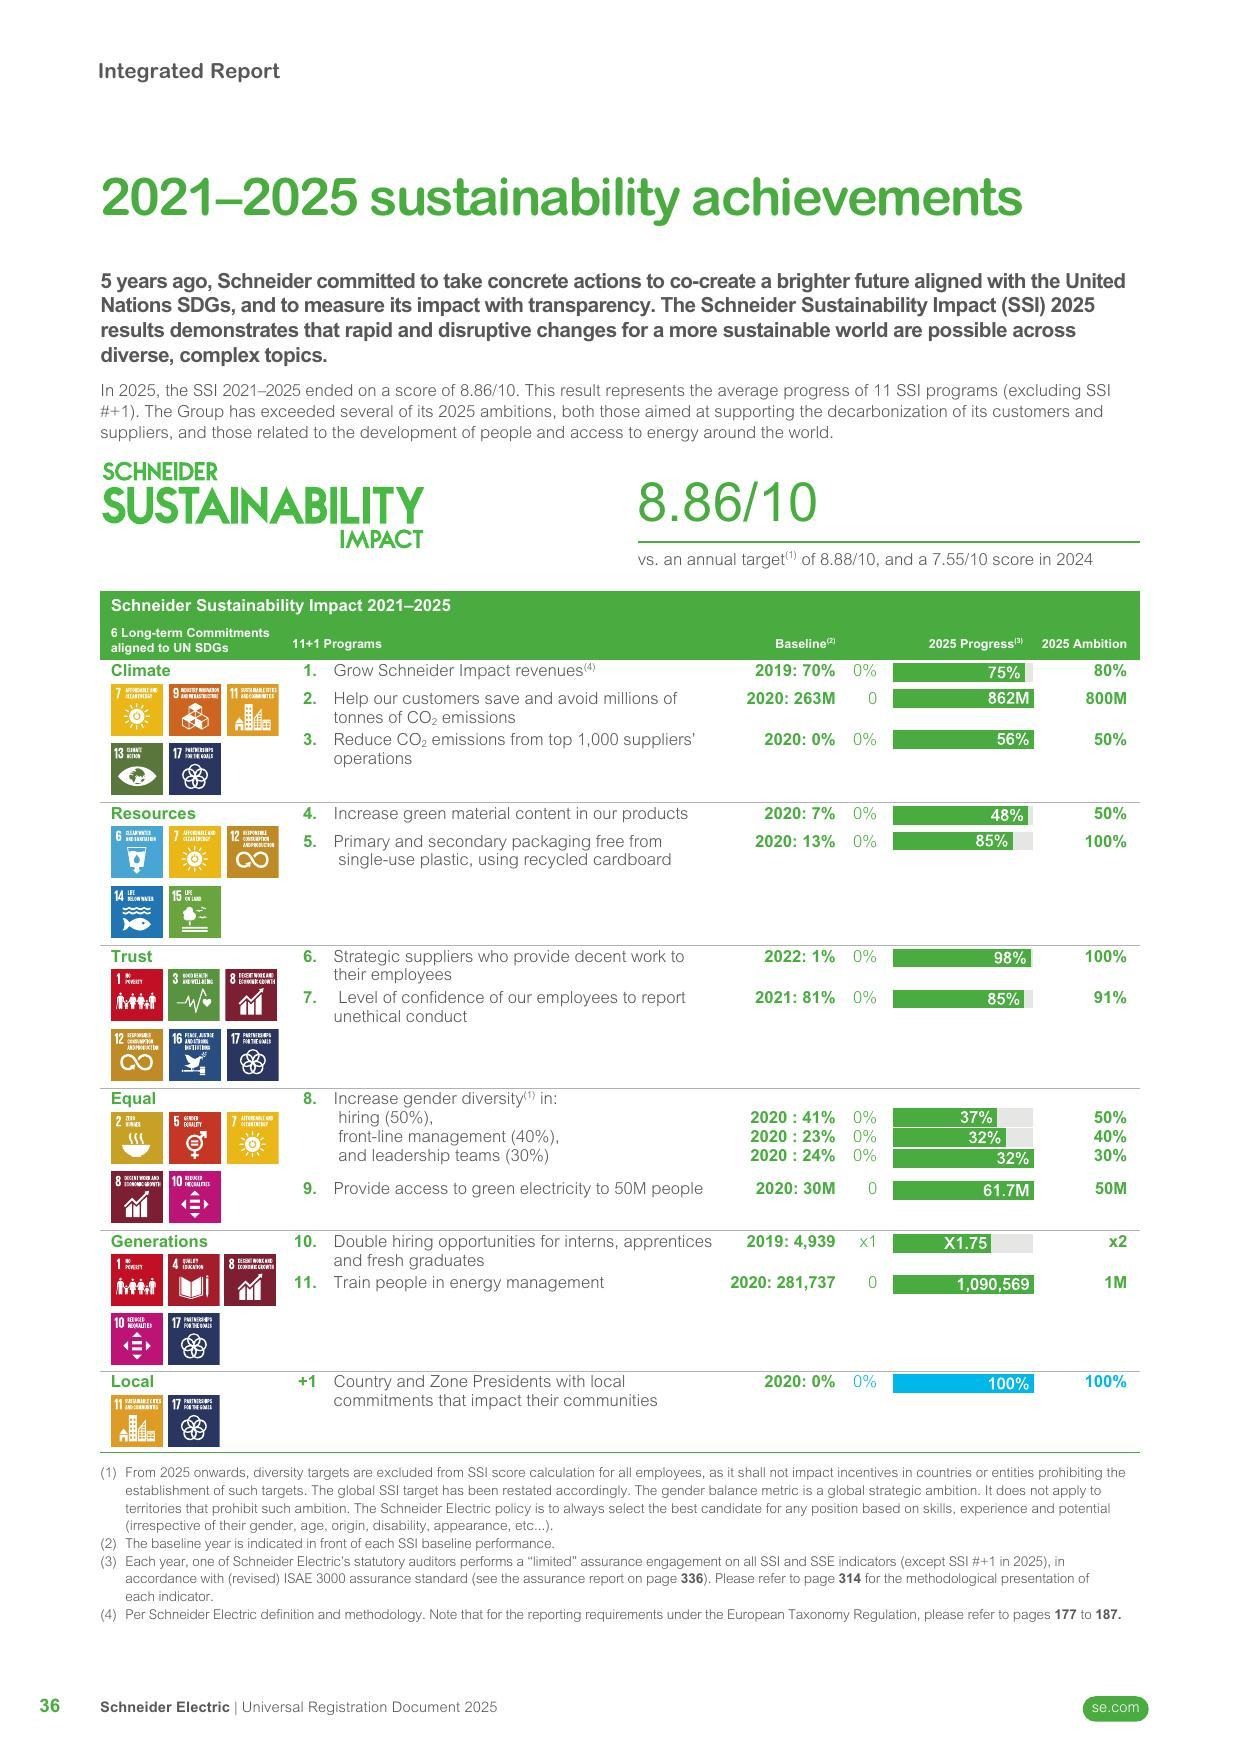
Schneider Electric 2025 URD, p. 36 — The 2021-2025 Schneider Sustainability Impact scorecard: final SSI score of 8.86/10 (vs. 8.88/10 annual target, and 7.55/10 in 2024). Each of the 11 programs shown with baseline, current progress and 2025 ambition — for example, 'Help customers save and avoid millions of tonnes of CO₂ emissions' at 862M vs 800M target, 'Grow Schneider Impact revenues' at 75% vs 80% target. Transparent, quarterly-tracked, externally-assured.
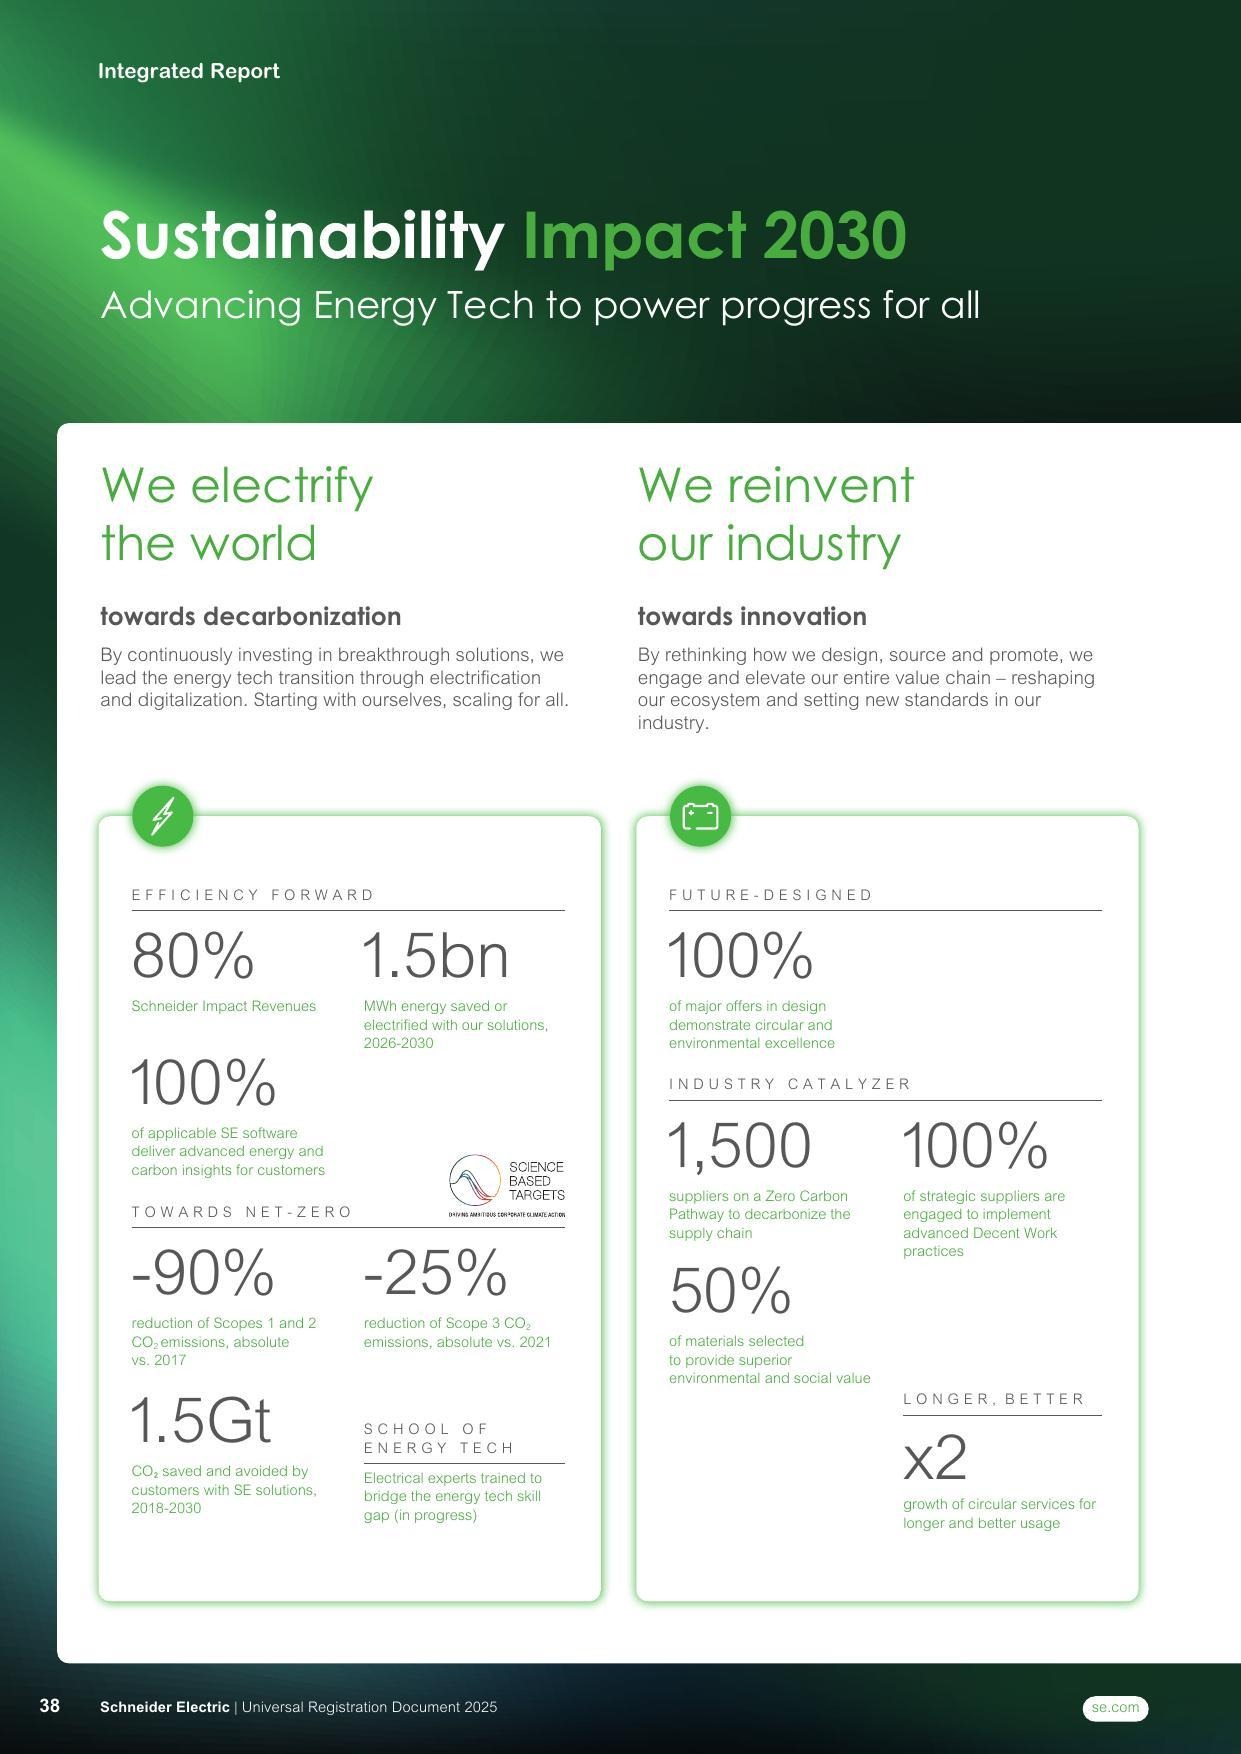
Schneider Electric 2025 URD, p. 38 — Introduction of the next-generation Sustainability Impact 2030 programme, 'Advancing Energy Tech to power progress for all'. The Group has disclosed how the 2021-2025 cycle translates into the new 2030 commitments, providing an unbroken progress narrative across decarbonisation, innovation, inclusion and resilience pillars.
7. Danone · FY2025 Report
Best practice: SBTi-validated absolute-reduction targets across all scopes, Danone Impact Journey Phase 1 with honest progress-to-date disclosure, and first-mover commitments on methane reduction in dairy.
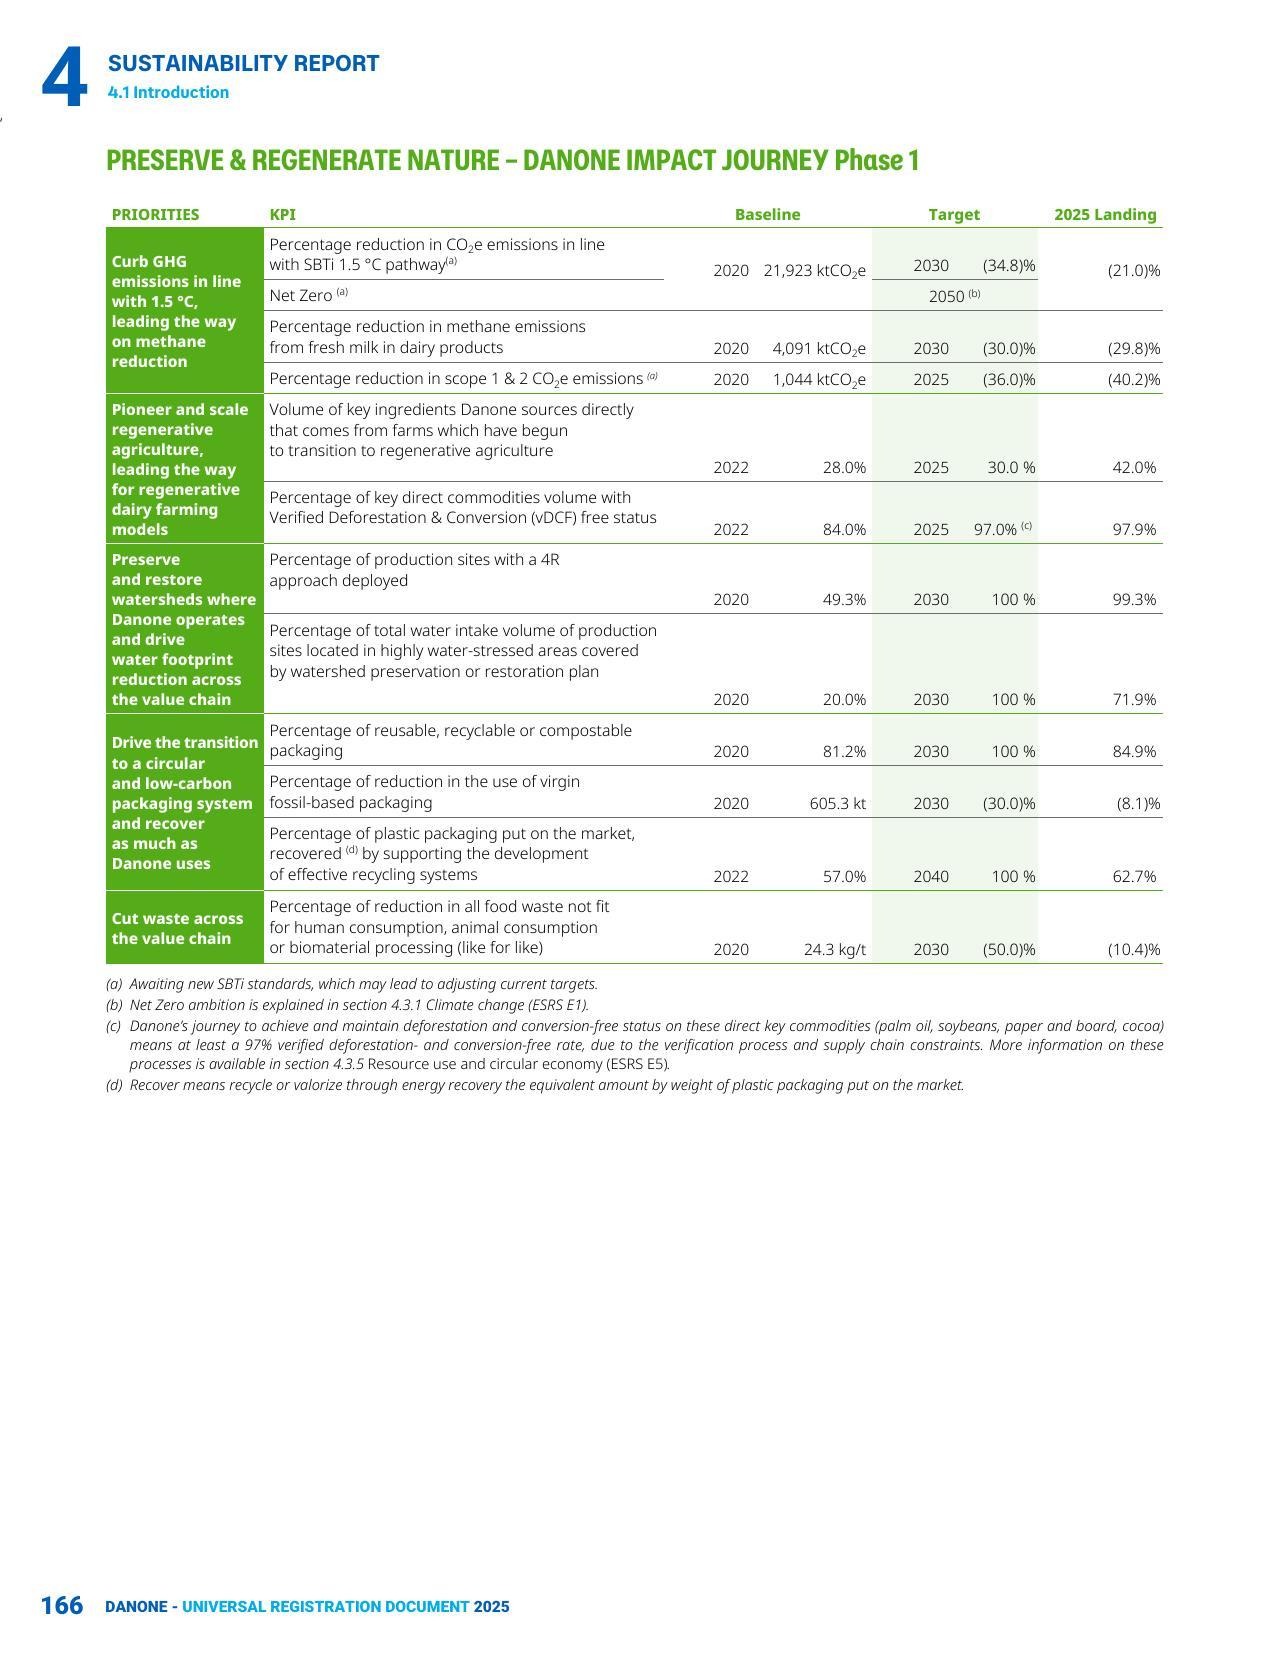
Danone 2025 URD, p. 166 — The Preserve & Regenerate Nature scorecard (Danone Impact Journey Phase 1) across five priority areas. Baselines, 2025 targets, 2030 targets and 2025 landings are disclosed in a single table, with several 2025 targets already exceeded: regenerative agriculture at 42% vs 30% target; deforestation-free key commodities at 97.9% vs 97% target; circular/recyclable packaging at 84.9%. Remaining gaps (e.g. water-stewardship at 71.9% vs 100% by 2030) are shown honestly.
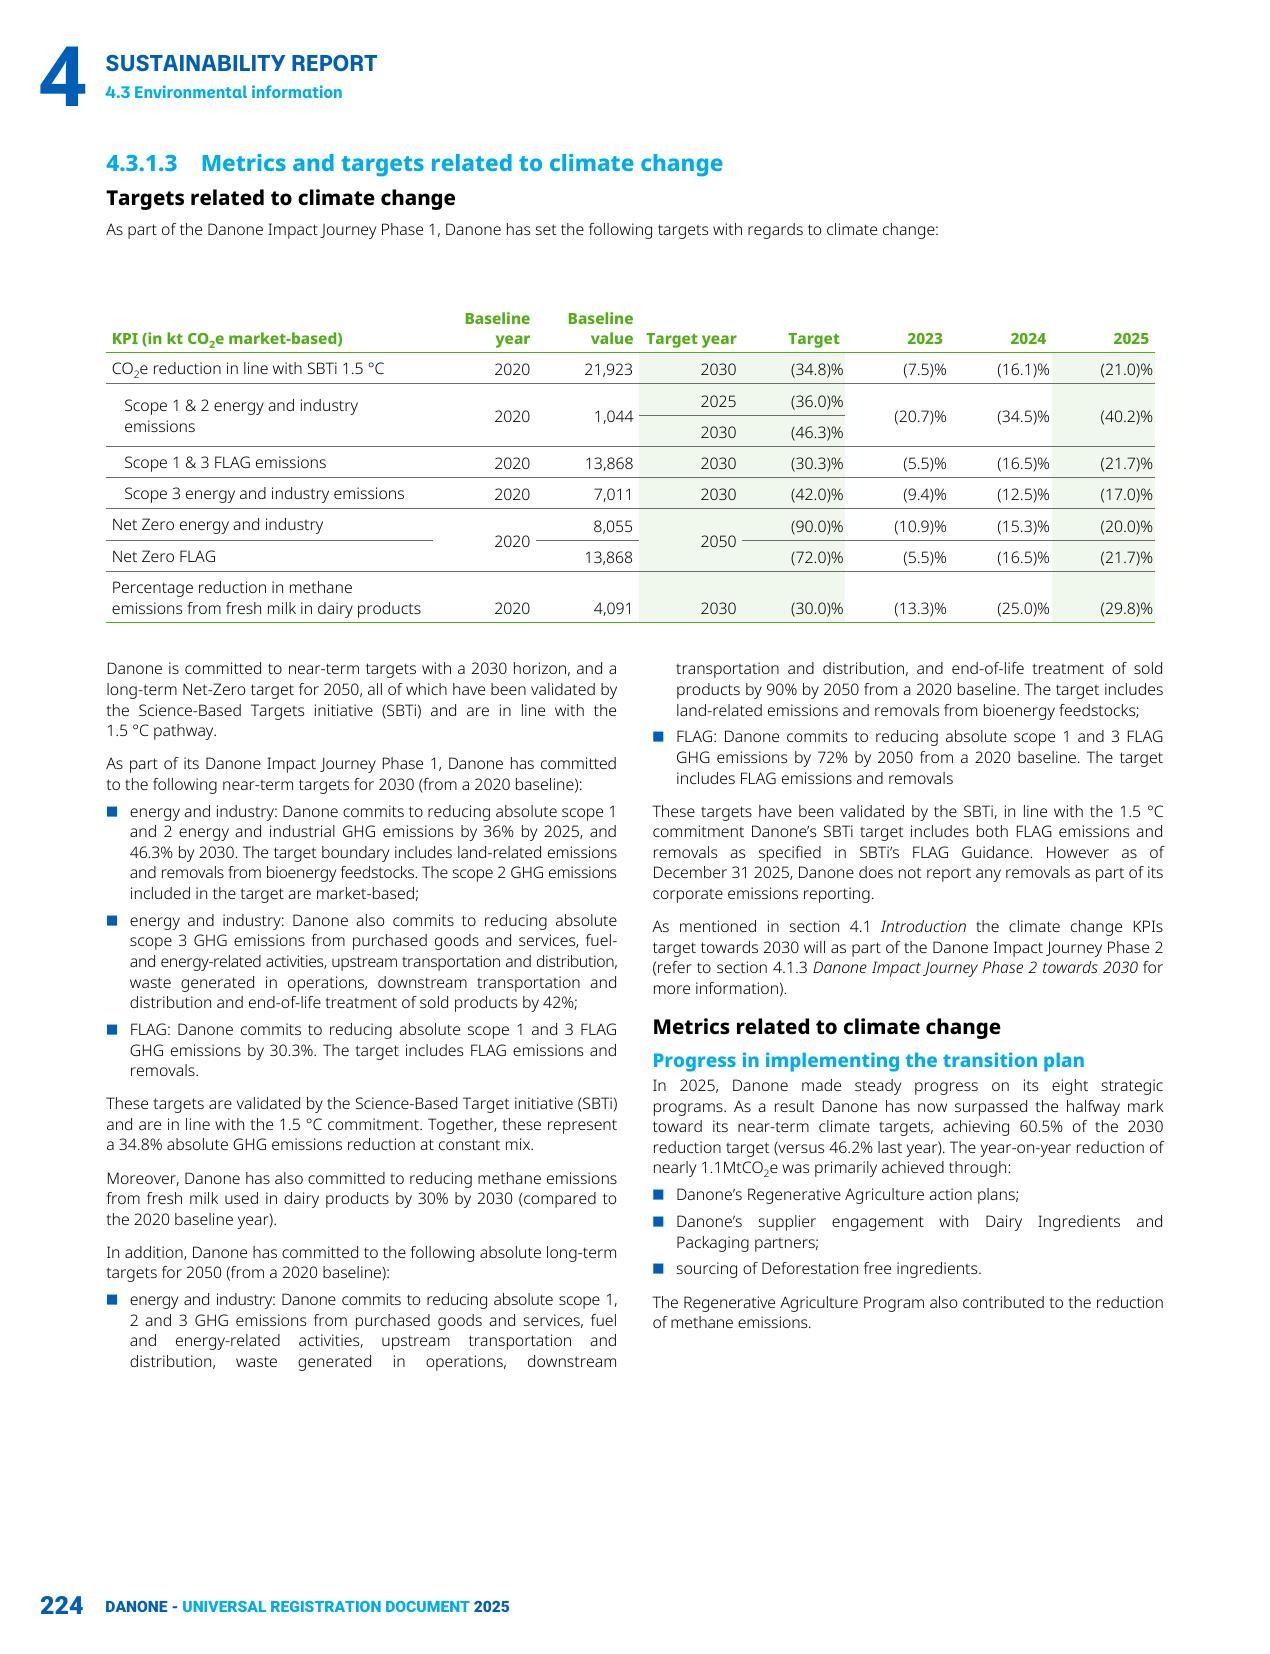
Danone 2025 URD, p. 224 — Climate change metrics and SBTi-validated targets with year-on-year progress columns for 2023, 2024 and 2025 against each KPI. Scope 3 FLAG emissions progressing at -21.7% vs 2030 target of -30.3%; methane from fresh milk in dairy at -29.8% already effectively at the 2030 target of -30.0%. Transparent annual cadence of progress disclosure is best-in-class.
8. Iberdrola · FY2025 Report
Best practice: Among very few utilities to meaningfully cover all 10 ESRS topical standards. External independent assurance at the front of the report. SBTi-certified pathway to carbon-neutral Scope 1 by 2030 and all-scopes net-zero by 2040.
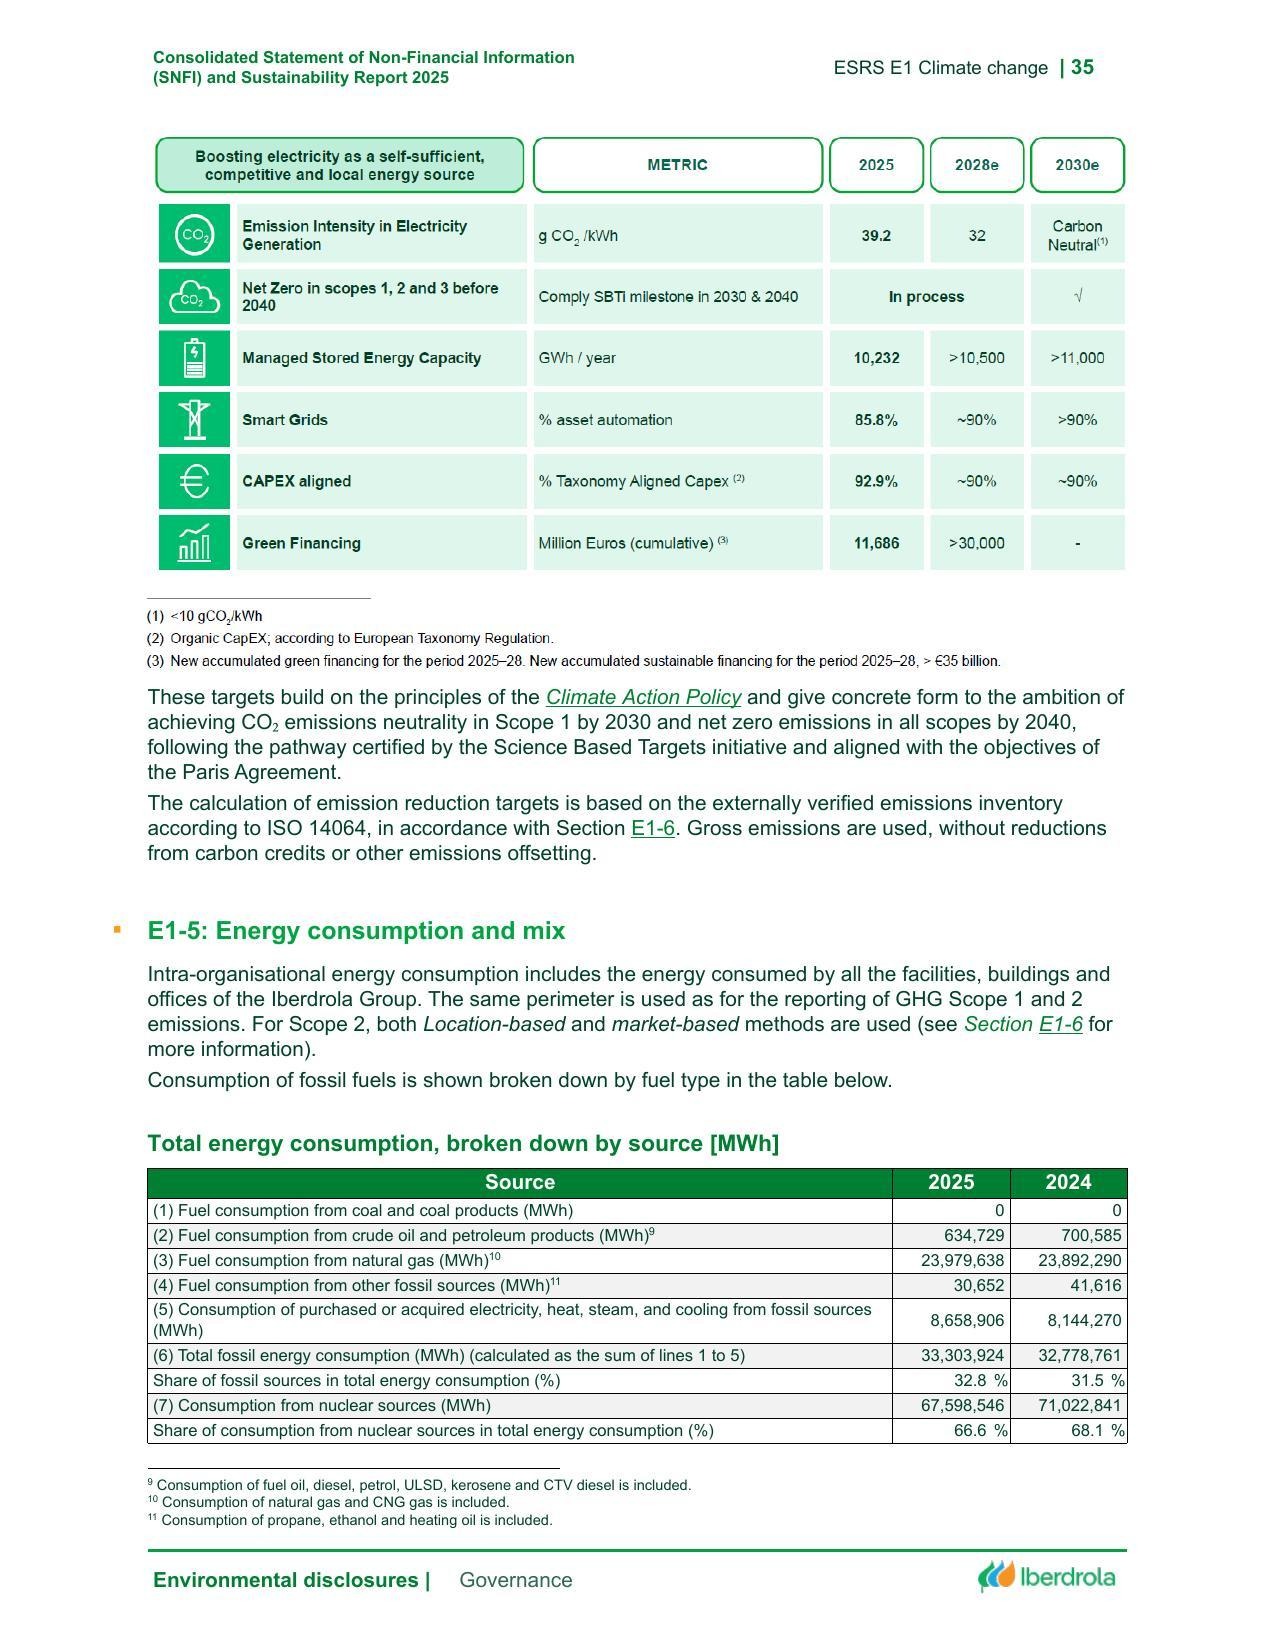
Iberdrola Sustainability Report 2025, p. 35 — Target table under the E1 Climate Change chapter 'Boosting electricity as a self-sufficient, competitive and local energy source', with 2025 actuals, 2028 estimates and 2030 estimates for emission intensity (39.2 → 32 → Carbon Neutral gCO₂/kWh), Net Zero milestone compliance, managed stored energy capacity, smart grids (85.8% → >90%), Taxonomy-aligned CAPEX (92.9% → >90%), and cumulative green financing (€11.7bn → >€30bn). Underpinned by SBTi certification.
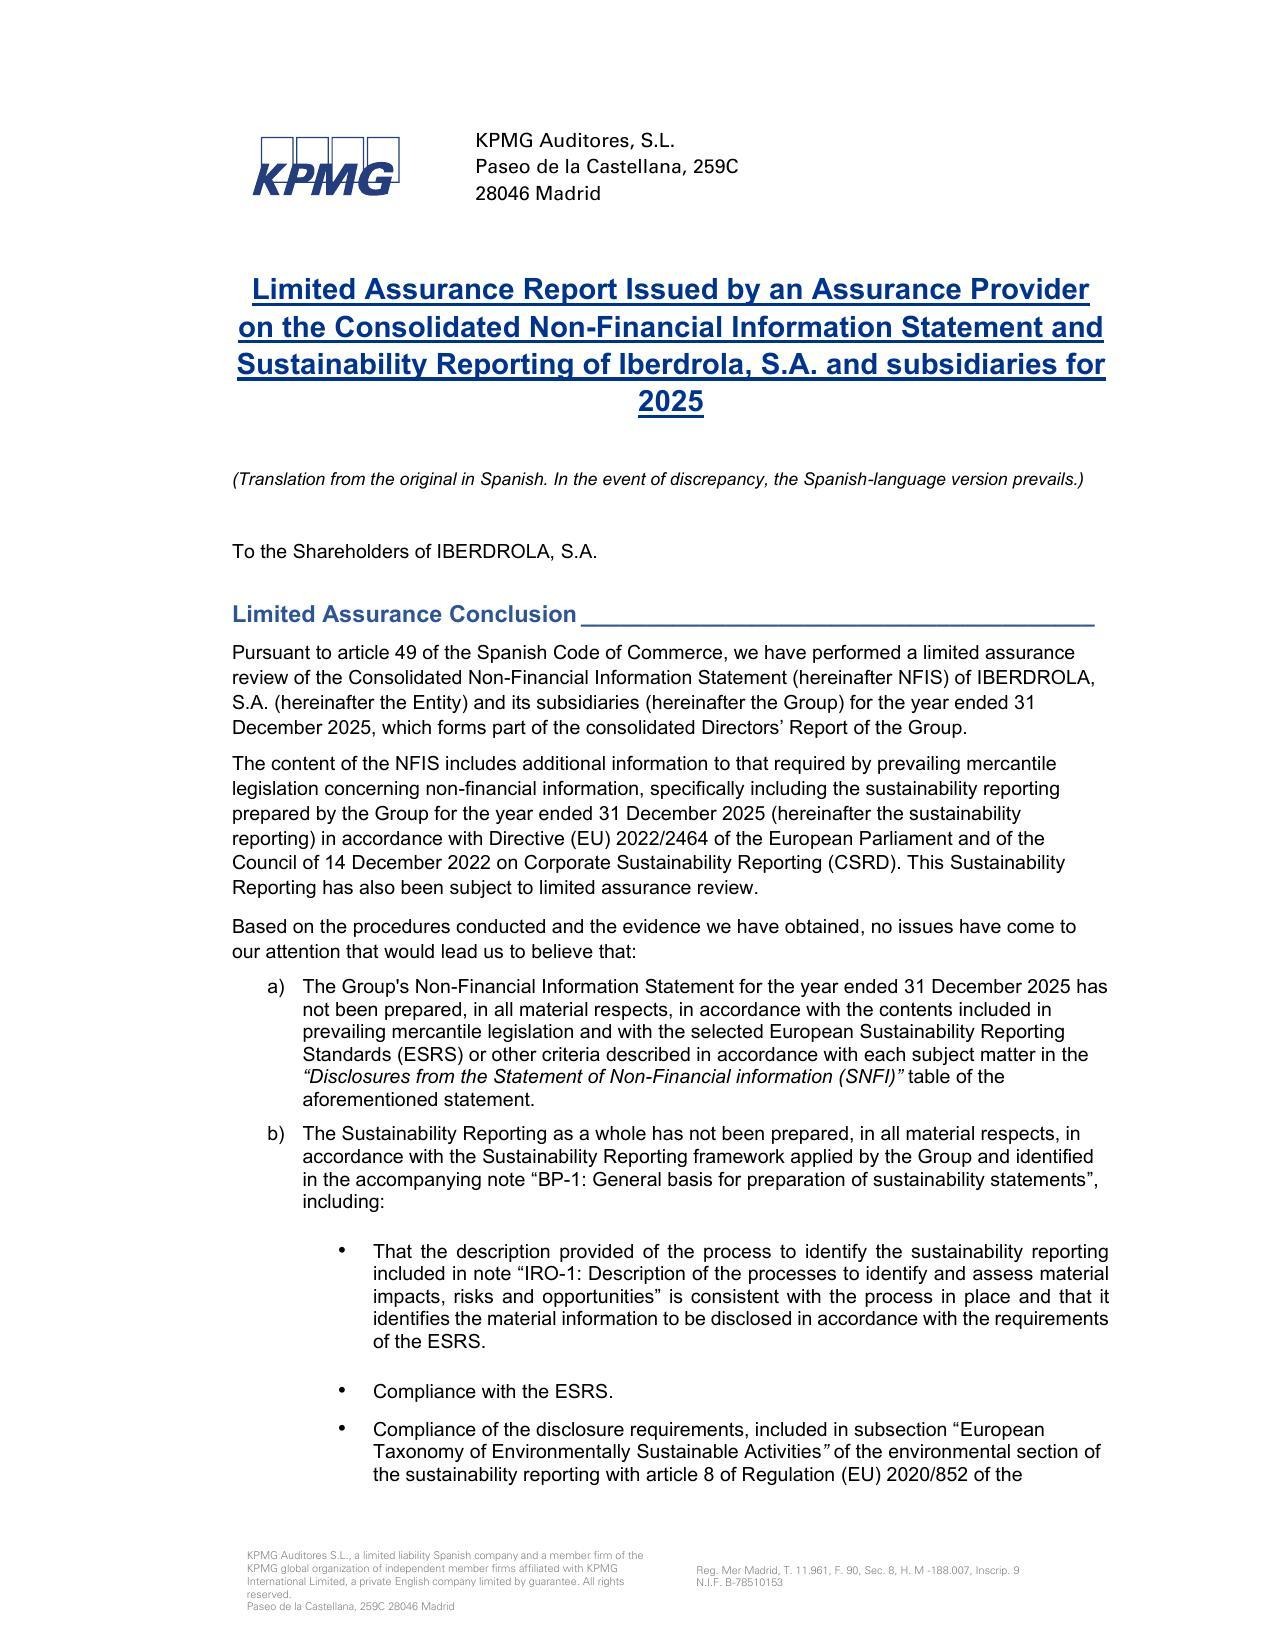
Iberdrola Sustainability Report 2025, p. 5 — KPMG's Limited Assurance Report placed at the FRONT of the document, immediately after the notice. External assurance positioned first is a rare but powerful transparency signal — the report opens with independent verification before the reader encounters any Iberdrola-authored narrative.
9. Ørsted · FY2025 Report
Best practice: Only major European utility in our cohort to have already achieved Scope 1+2 carbon-neutrality. Pure-play transition model aligns targets with operating reality.
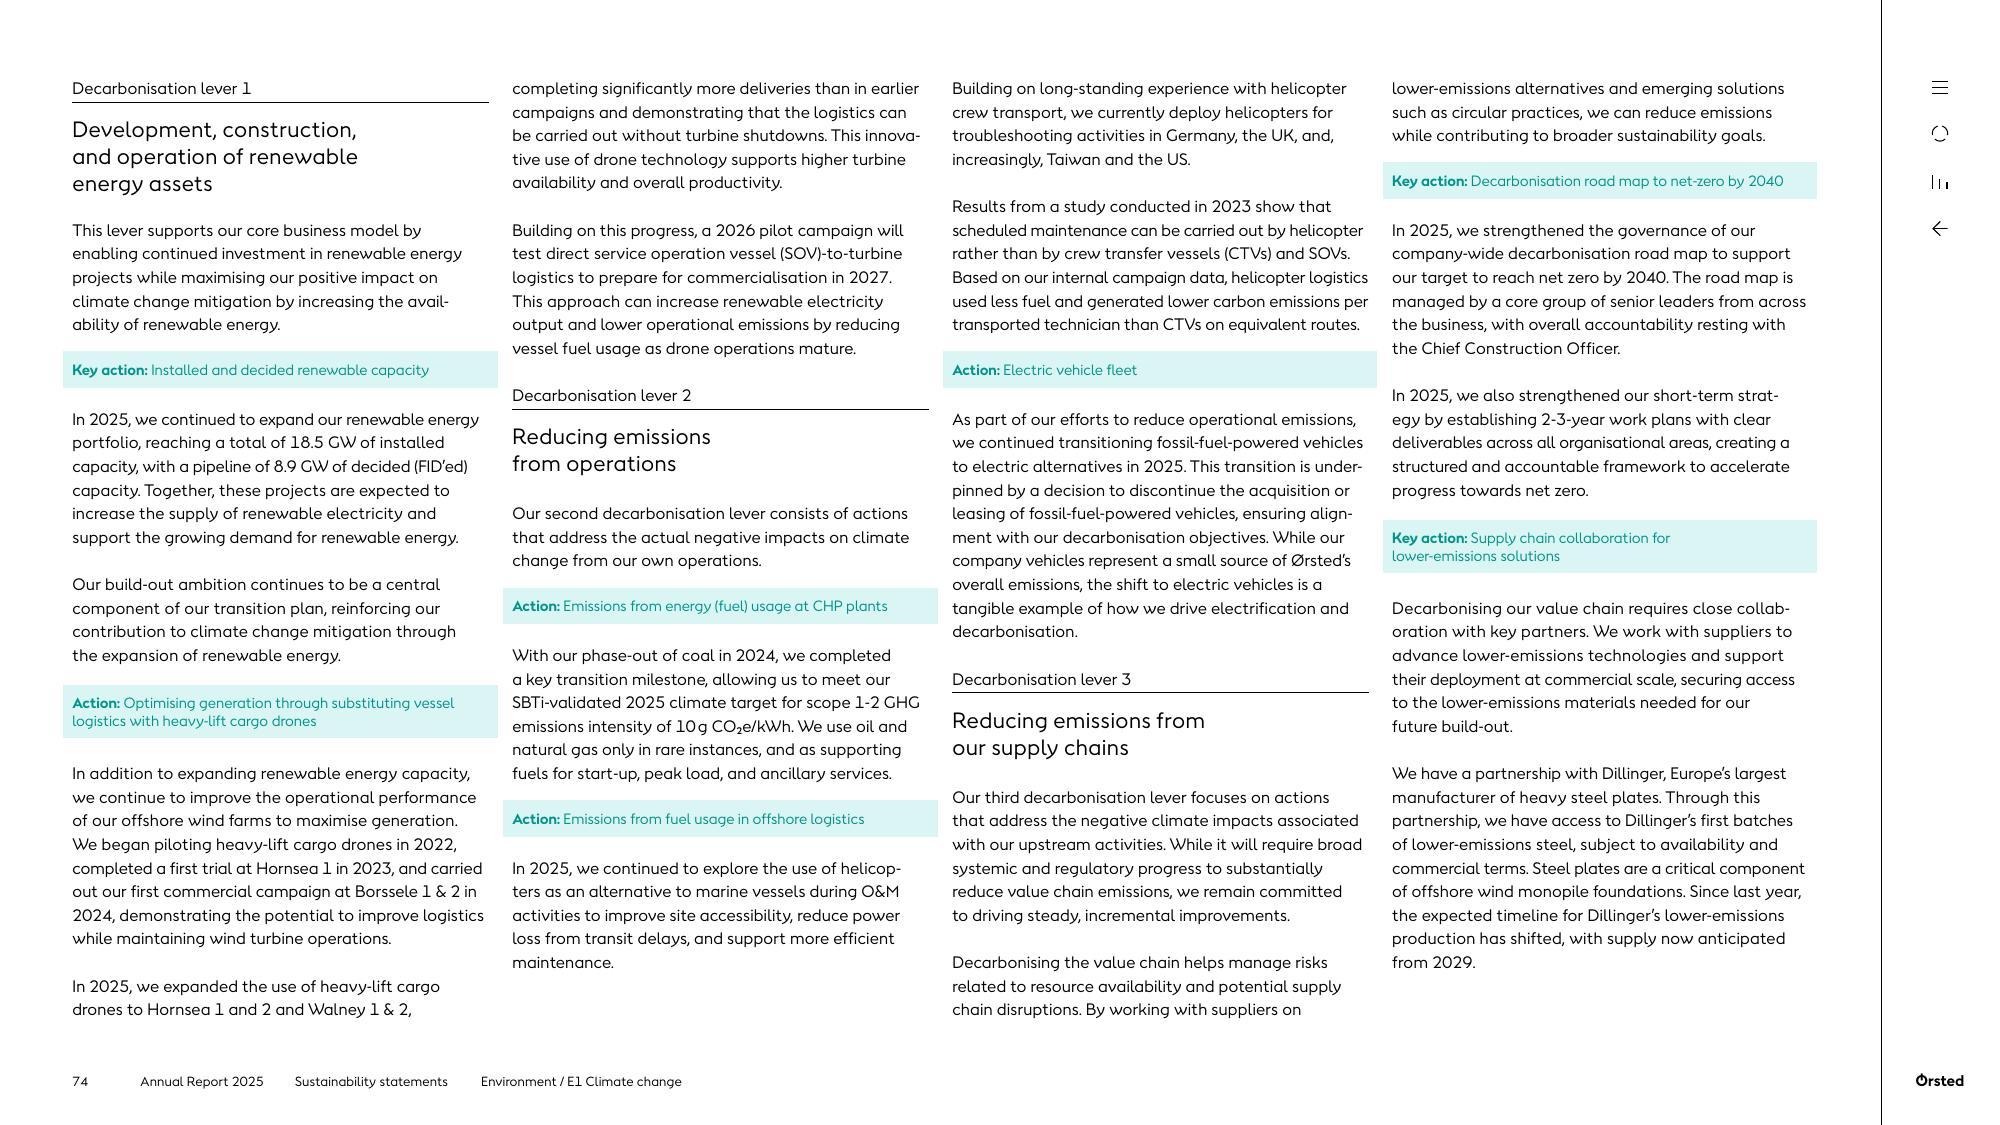
Ørsted Annual Report 2025, p. 74 — Three Decarbonisation Levers disclosure: (1) development/construction/operation of renewable assets, (2) reducing emissions from operations (including completed coal phase-out in 2024 and SBTi-validated 2025 scope 1-2 intensity target of 10 gCO₂e/kWh), and (3) reducing emissions from the supply chain via low-emissions steel partnerships.
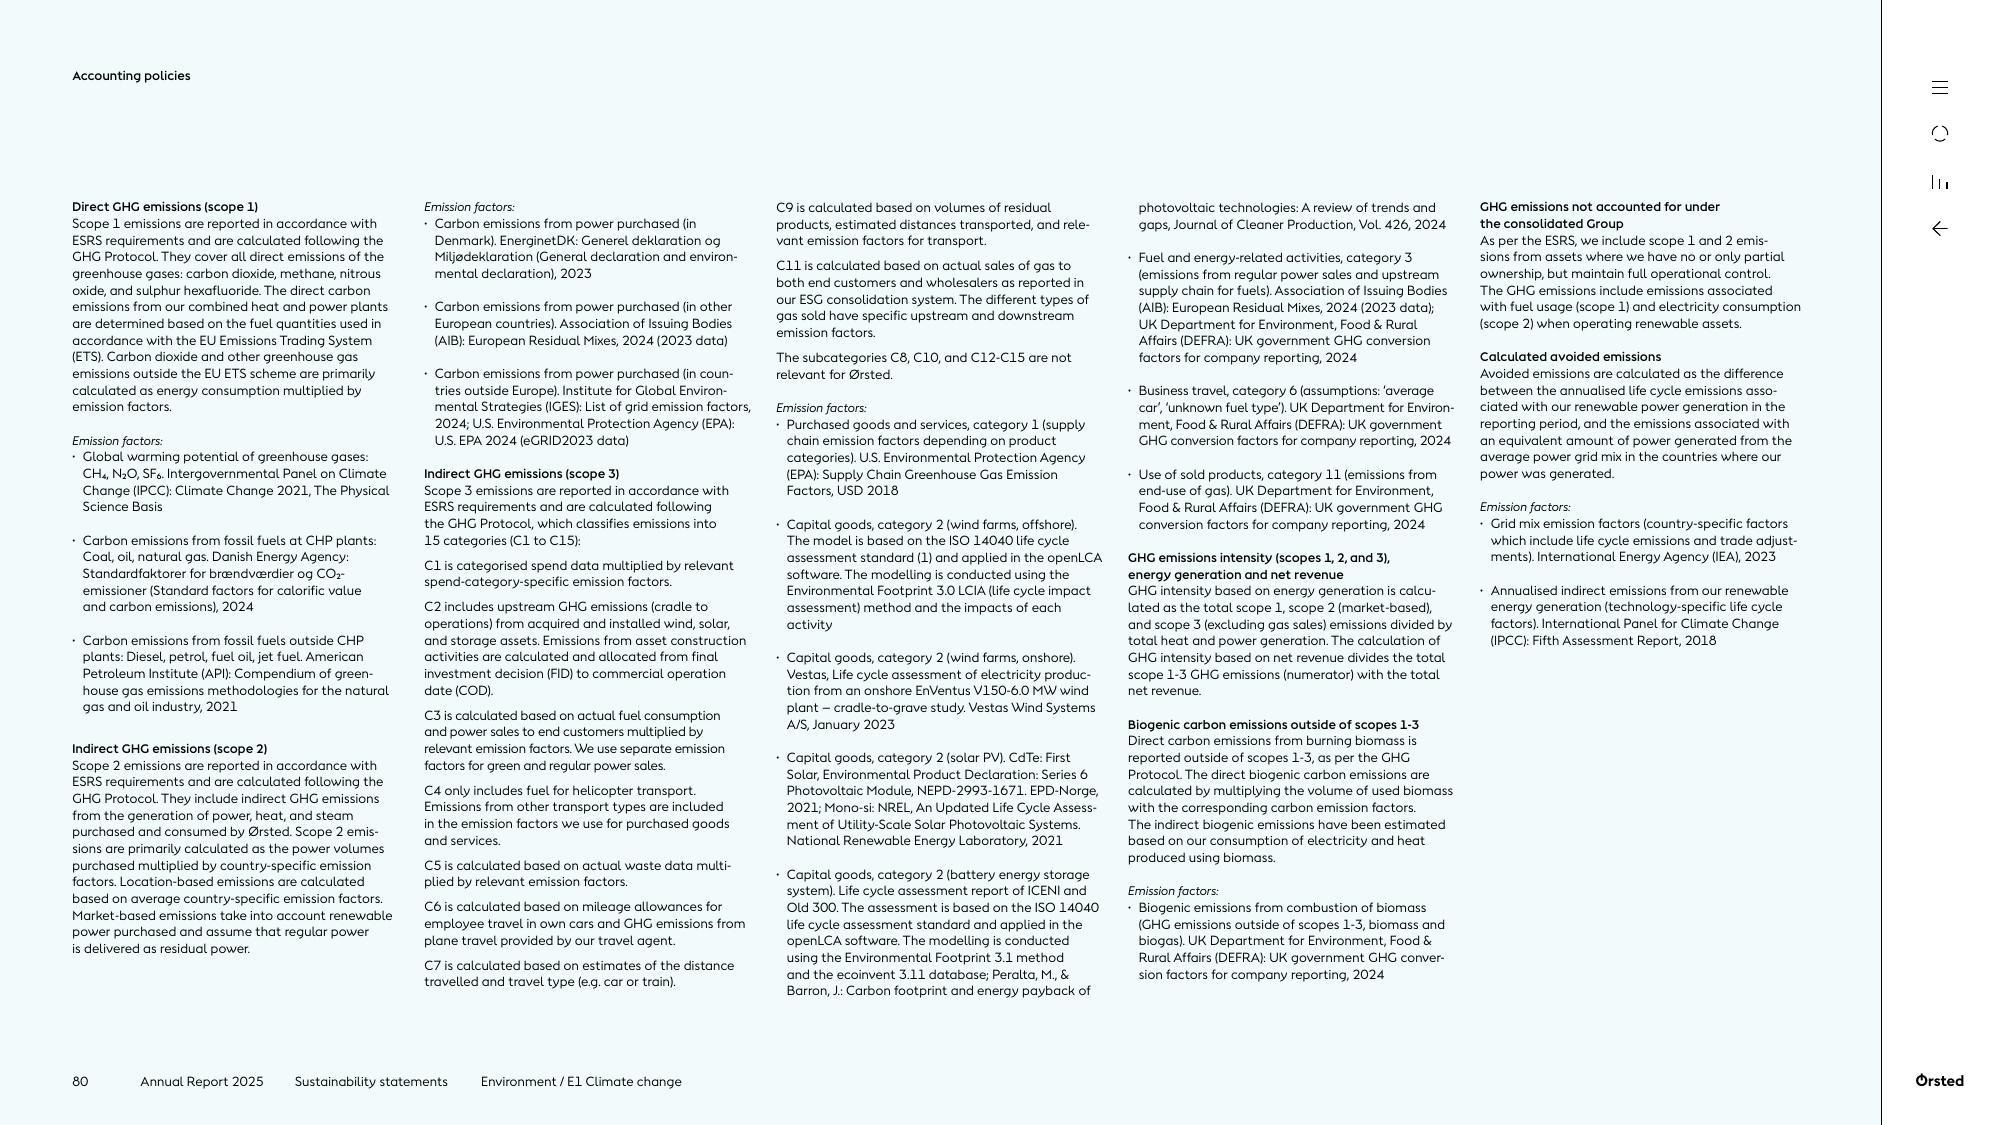
Ørsted Annual Report 2025, p. 80 — GHG accounting policies page showing rigorous disclosure of emission factors, calculation methodology, Scope 1 (direct GHG), Scope 2 (indirect GHG from electricity/heat/steam) and 15 Scope 3 categories with methodology references. Exceptional methodological transparency for a large-cap utility.
10. SAP · FY2025 Report
Best practice: Second year under ESRS with reasonable assurance (not just limited) on selected KPIs — a level of audit depth rare in European software. Clean IRO mapping and a visual GHG-reduction waterfall.
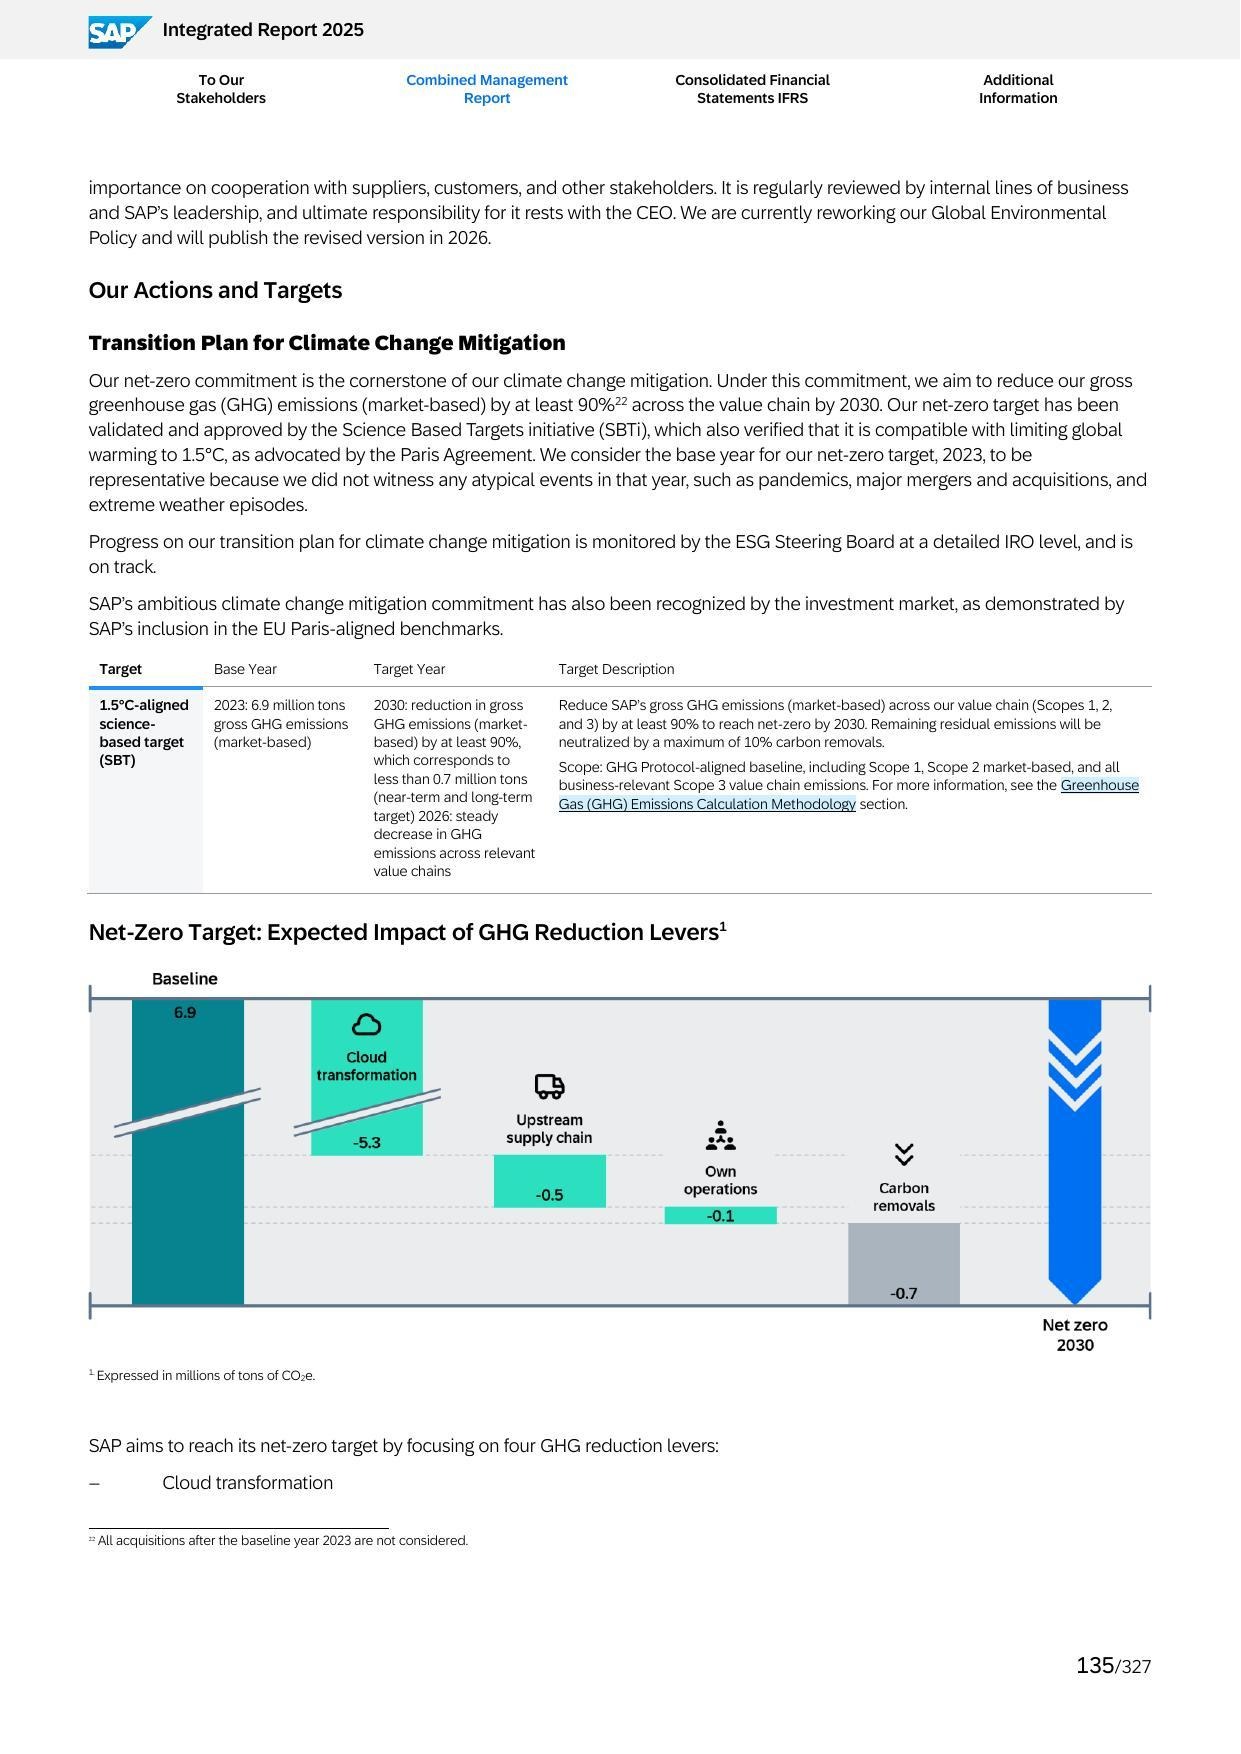
SAP Integrated Report 2025, p. 135 — The 1.5°C-aligned SBTi-validated Net-Zero target with baseline (2023: 6.9 MtCO₂e gross GHG, market-based), target year 2030 (-90% reduction, corresponding to <0.7 Mt), and a distinctive visual GHG-reduction waterfall showing the four reduction levers: Cloud transformation (-5.3 Mt), Upstream supply chain (-0.5 Mt), Own operations (-0.1 Mt) and Carbon removals (-0.7 Mt). Transparent pathway visualisation is a rare-and-valuable best practice.
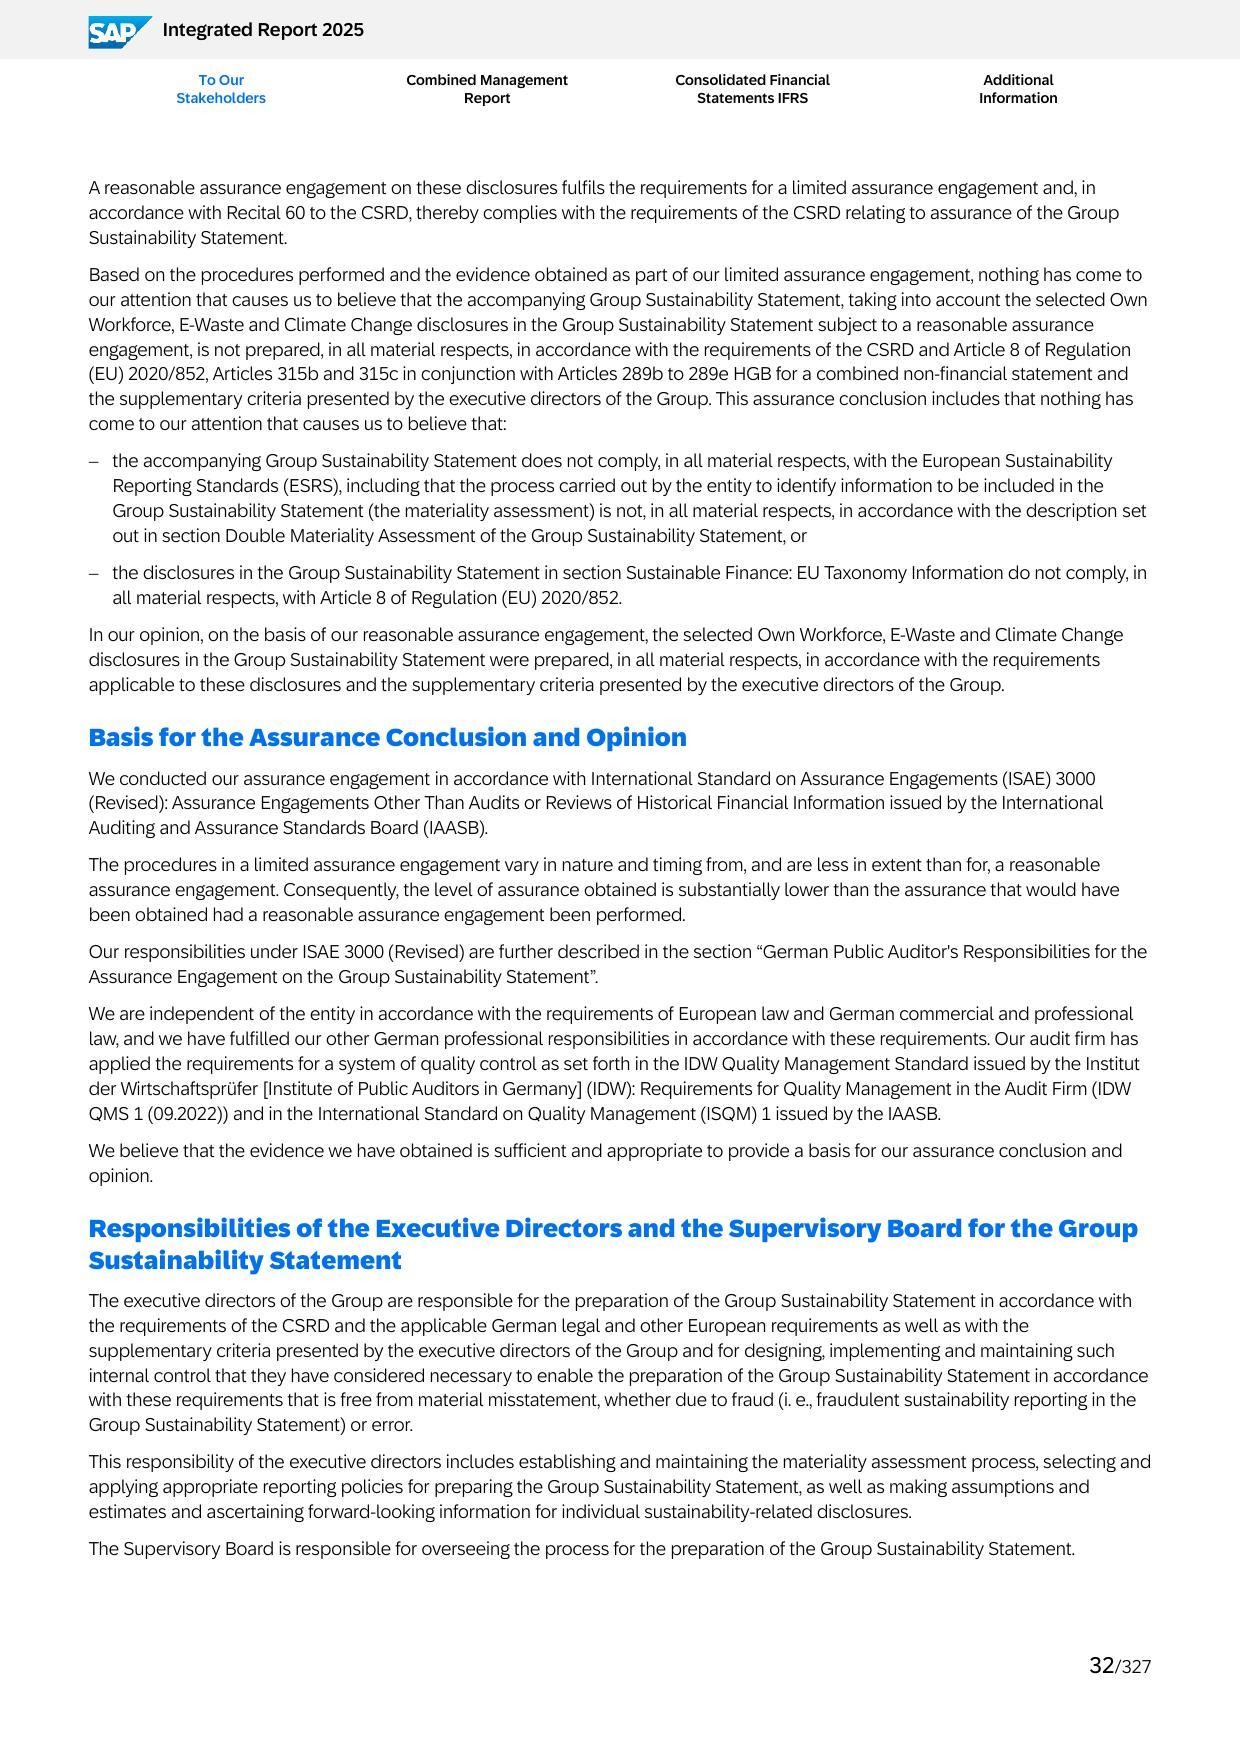
SAP Integrated Report 2025, p. 32 — Independent auditor's assurance conclusion confirming that REASONABLE assurance (beyond the limited-assurance floor required by CSRD) has been provided on selected Own Workforce, E-Waste and Climate Change disclosures. This level of audit depth is rare in European software and is a distinguishing quality signal.
Several other companies produced strong reports that would merit consideration in any best-practice discussion: Inditex delivered its second full CSRD statement with 26% supply-chain water reduction achieved ahead of schedule and 88% preferred-fibres use already in place. British American Tobacco achieved CDP Triple A and the Thrive farmer-livelihoods programme reaches over 80,000 contracted farmers with quantified economic-impact tracking, despite the core-product health challenge. Enel has one of the most aggressive climate trajectories in European utilities (-80% Scope 1+2 by 2030) alongside a just-transition framework. BASF voluntarily applied ESRS and delivered comprehensive Verbund-site efficiency data. AstraZeneca committed to -98% Scope 1+2 by 2026 under its Ambition Zero Carbon programme, an unusually aggressive interim target. Unilever's Compass strategy includes living wage achieved across own operations in 2020 — though recent target recalibrations have cost some credibility.
Three ESRS topical standards were disclosed as material by every single one of the 250 companies: E1 Climate Change, S1 Own Workforce, and G1 Business Conduct. This universality is unsurprising — climate, workforce and business conduct have become baseline topics across almost every sector and business model — but the consistency is worth emphasising because it is the structural foundation that makes cross-company benchmarking possible in the first place. Any meaningful peer comparison on CSRD disclosure runs through E1, S1 and G1 first.
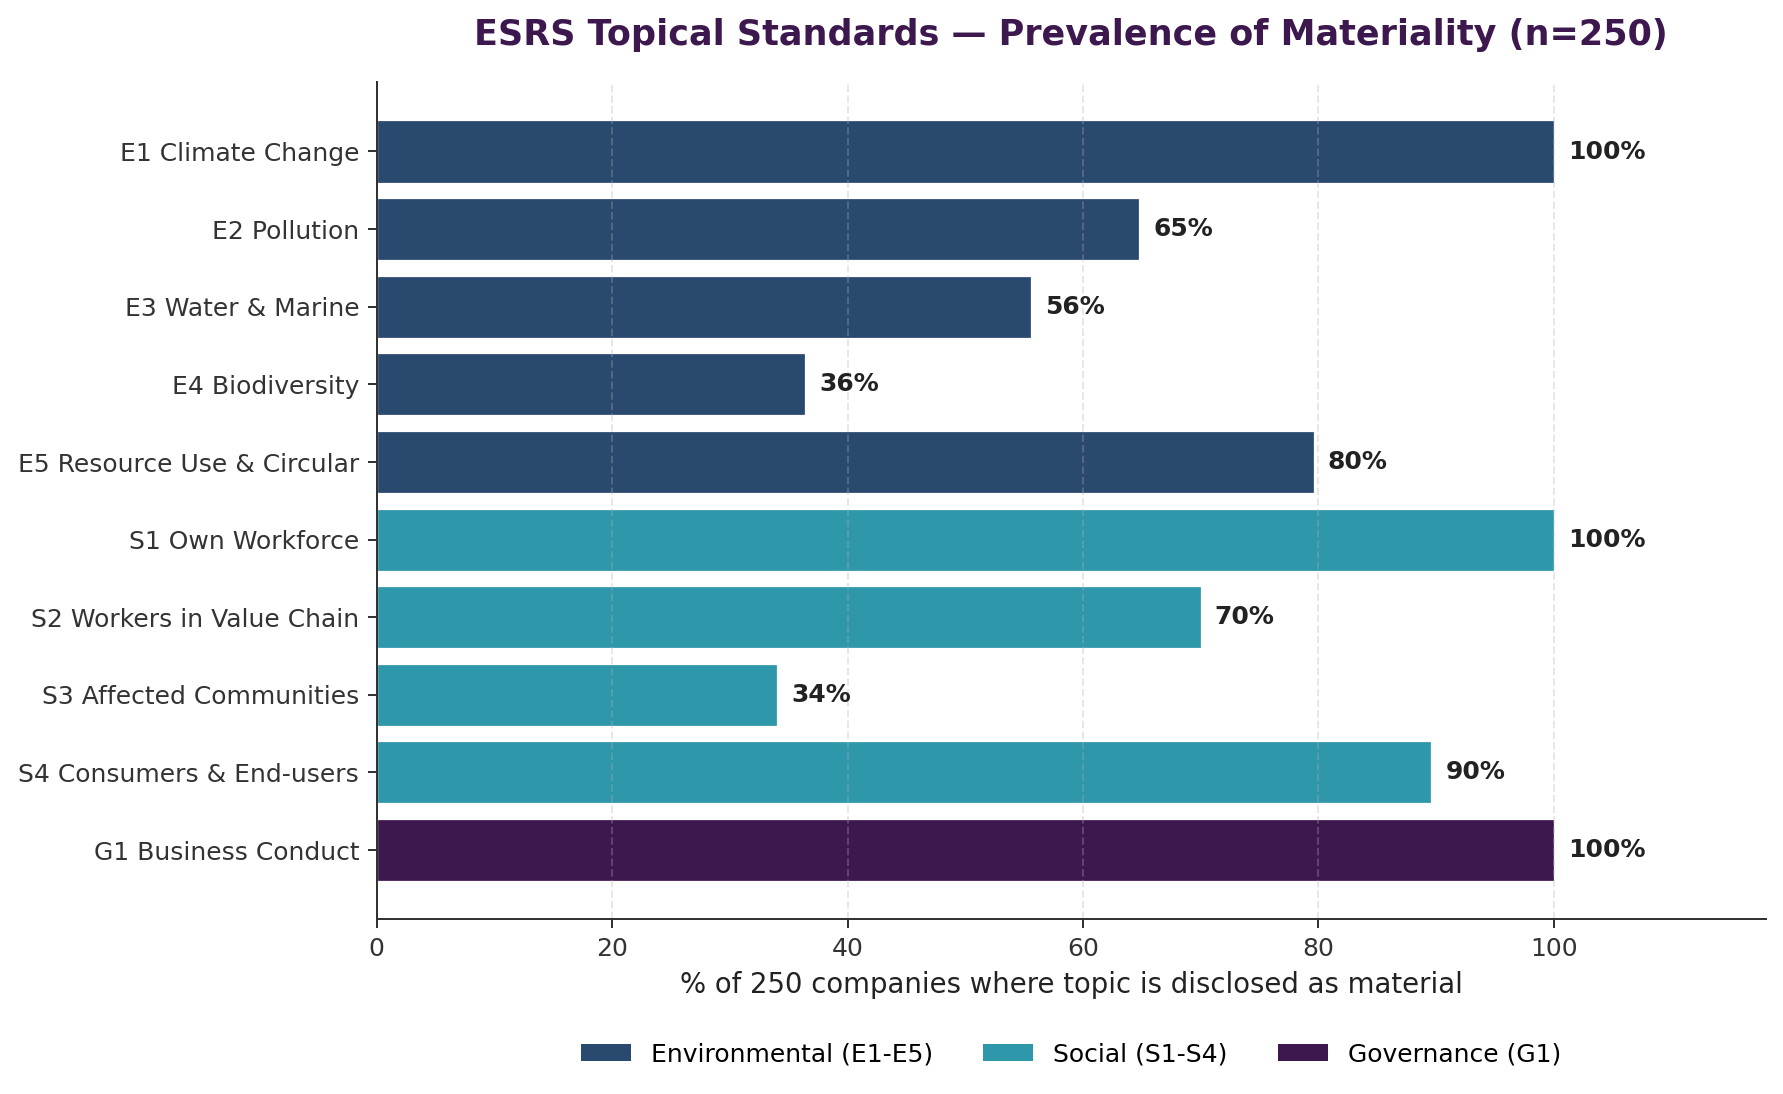
The most variable topics are E4 Biodiversity (36% of companies) and S3 Affected Communities (34%). Their low prevalence reflects a genuine sector reality: biodiversity is most acutely material for agriculture-, mining-, real-estate- and construction-adjacent businesses; affected-community impacts are concentrated in mining, energy, infrastructure, utilities and consumer goods with resource-intensive sourcing. Banks, insurers and software companies largely — and we believe defensibly — determined these topics to be immaterial under ESRS 1. That said, the momentum around TNFD (Taskforce on Nature-related Financial Disclosures) means we expect E4 prevalence to drift upward in FY2026 and FY2027 as more financial-sector issuers begin to surface financed-biodiversity risk.
E5 Resource Use & Circular Economy appears at 80% — broader than many observers may have expected — driven by nearly-universal disclosure on waste, packaging and product-stewardship topics across consumer-facing sectors. S4 Consumers & End-users at 90% reflects how central product quality, customer protection, data privacy and access-to-products framing has become across financial services, pharma, technology and consumer-facing businesses.
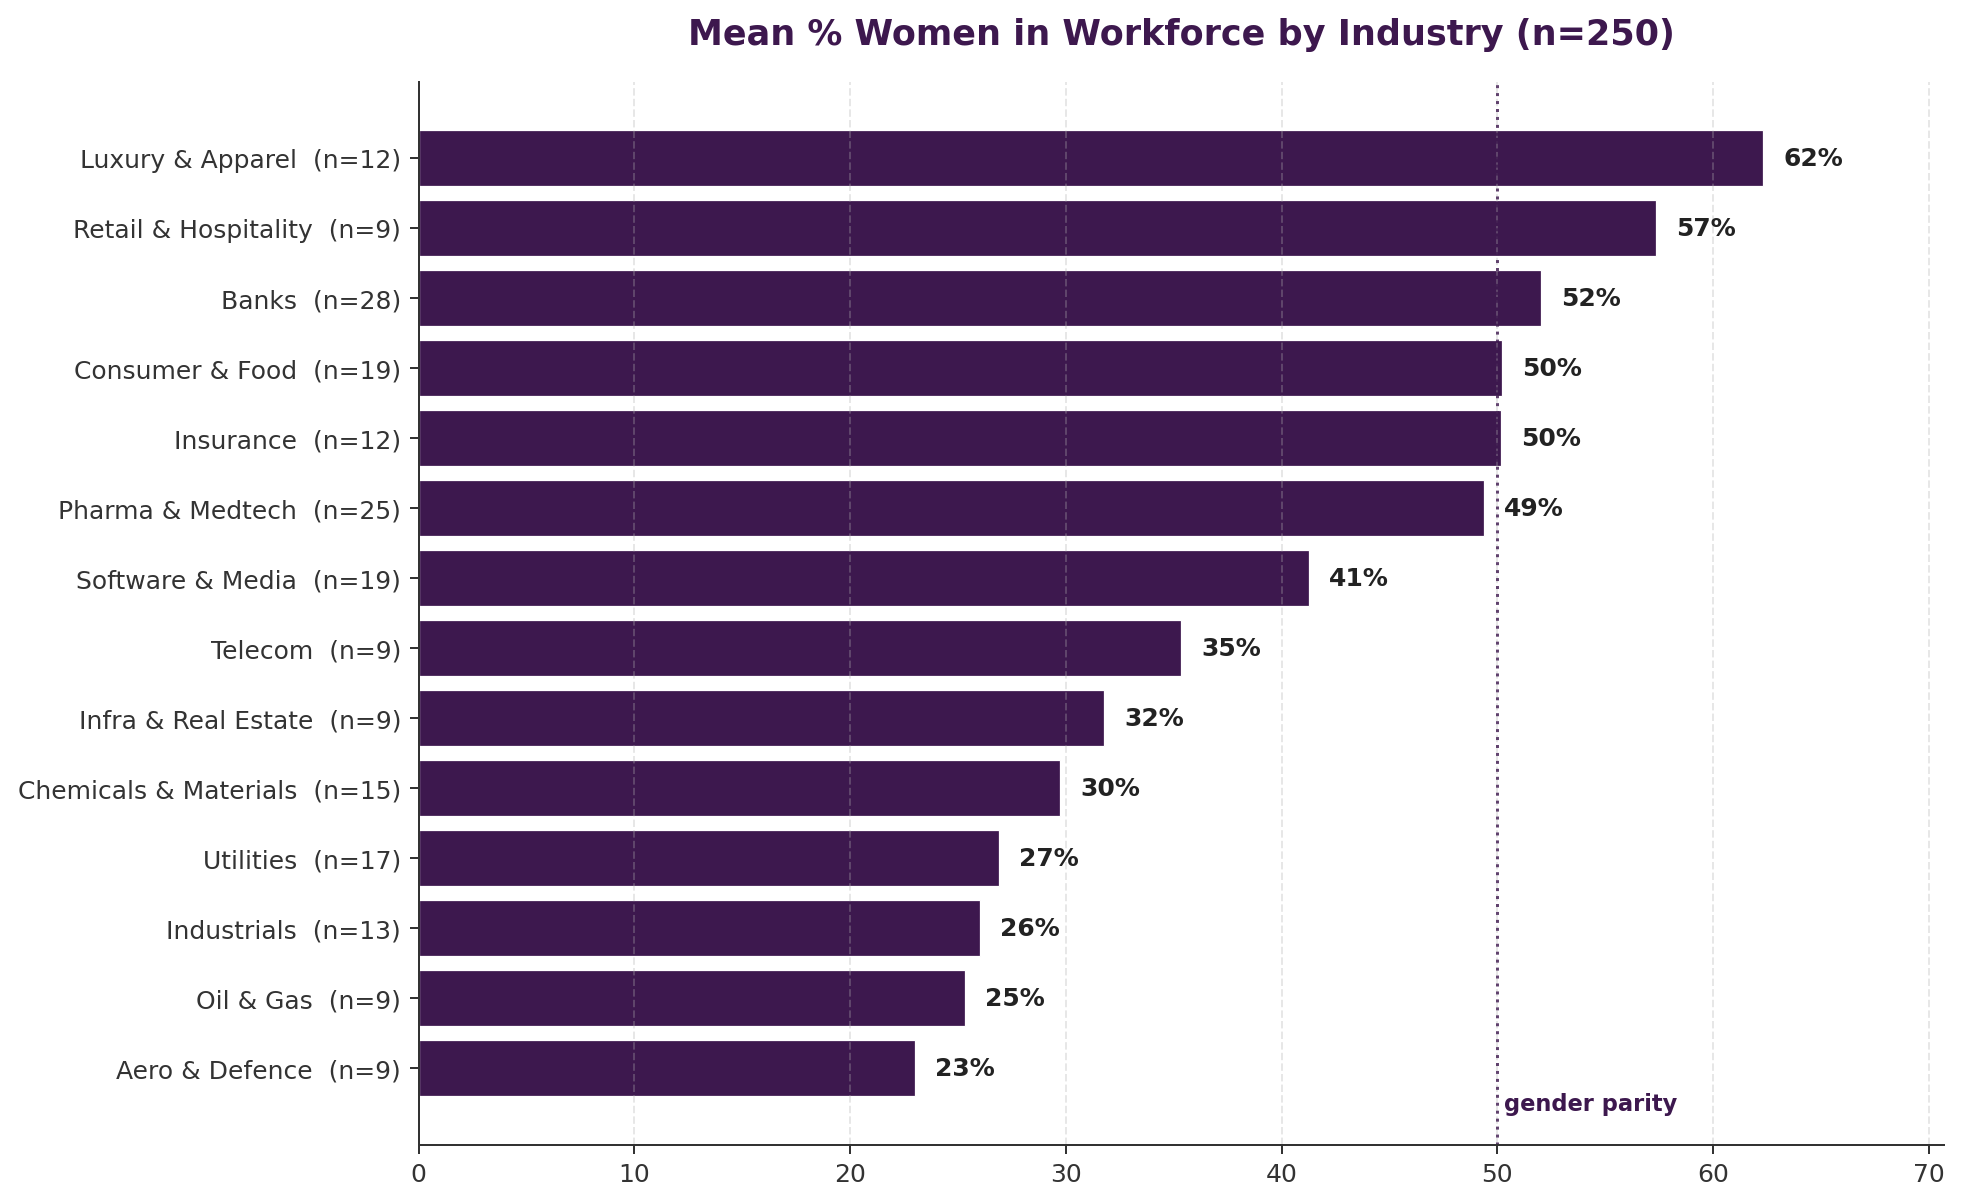
One of the most useful analytical cuts in our dataset is the industry view — because it shows at a glance where each sector stands on the disclosure dimensions that CSRD and voluntary-aligned reports consistently surface. We have produced four side-by-side industry charts below, ordered from most-variable (% women) to most-structural (IROs), to highlight how different the operating reality is from sector to sector.
Gender representation in the total workforce clusters into three tiers. Consumer-facing and service-intensive sectors (Luxury & Apparel at ~62%, Retail & Hospitality at ~57%, Banks at ~52%) are above or close to parity. Professional-services and knowledge-economy sectors (Consumer & Food, Insurance, Pharma & Medtech, Software & Media) cluster around the 40-50% band. Industrial and extractive sectors (Utilities, Industrials, Oil & Gas, Aero & Defence) remain materially below 30%, driven by historical workforce structures that have yet to be recomposed. The gap between the top and bottom sector is close to 40 percentage points — one of the widest gender distributions across any metric we tracked.
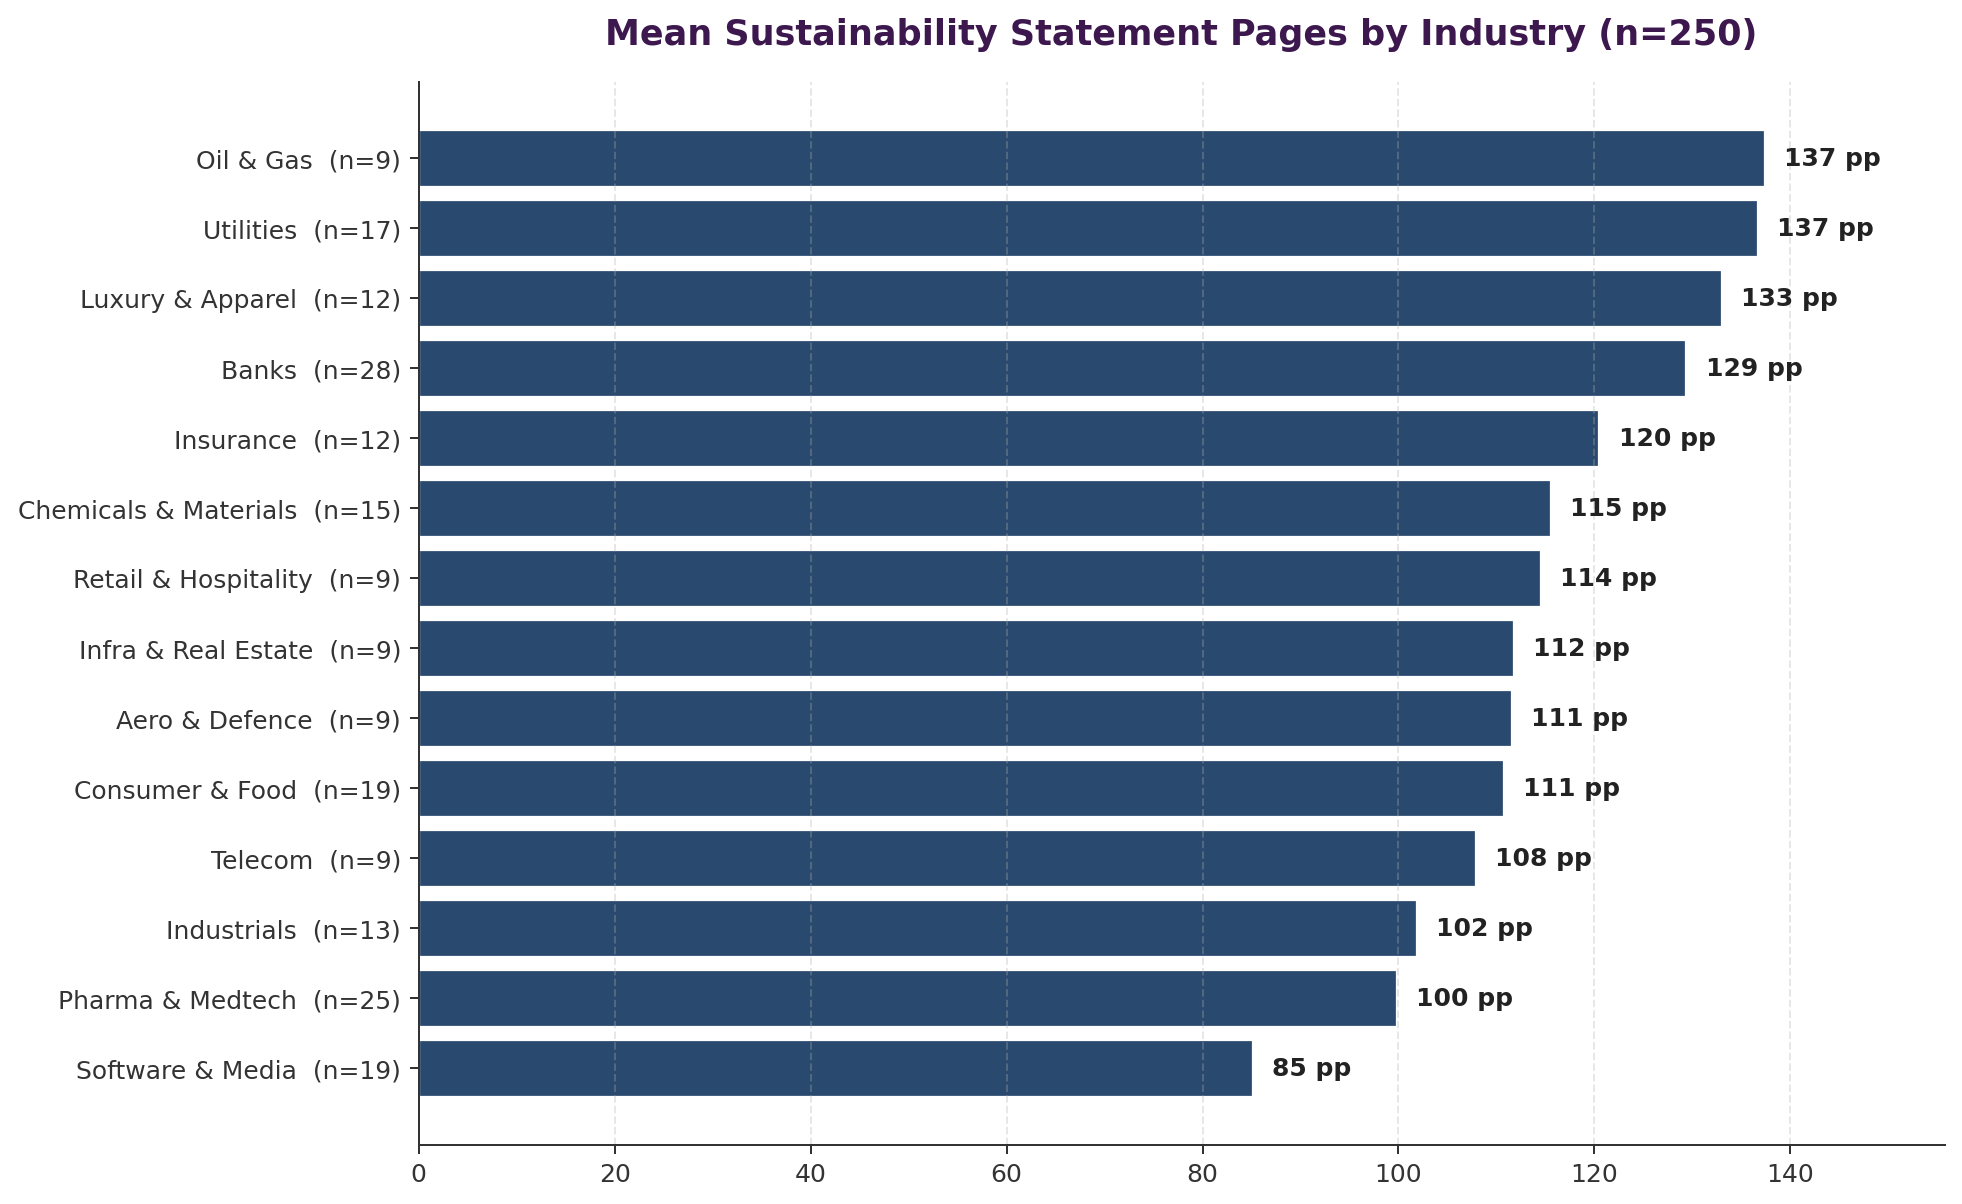
The length of the sustainability statement — which we treat as a rough proxy for disclosure depth — also varies markedly by industry. Sectors whose operating model touches many ESRS topical standards (Oil & Gas, Utilities, Chemicals & Materials, Consumer & Food, Banks with their large financed-emissions sections) produce the longest disclosures. Software & Media, Telecom and Insurance produce materially shorter statements, consistent with narrower materiality. This is not, on its own, a quality signal — a longer statement is not automatically a better one — but it is a useful ordering when benchmarking report scope against sector peers.
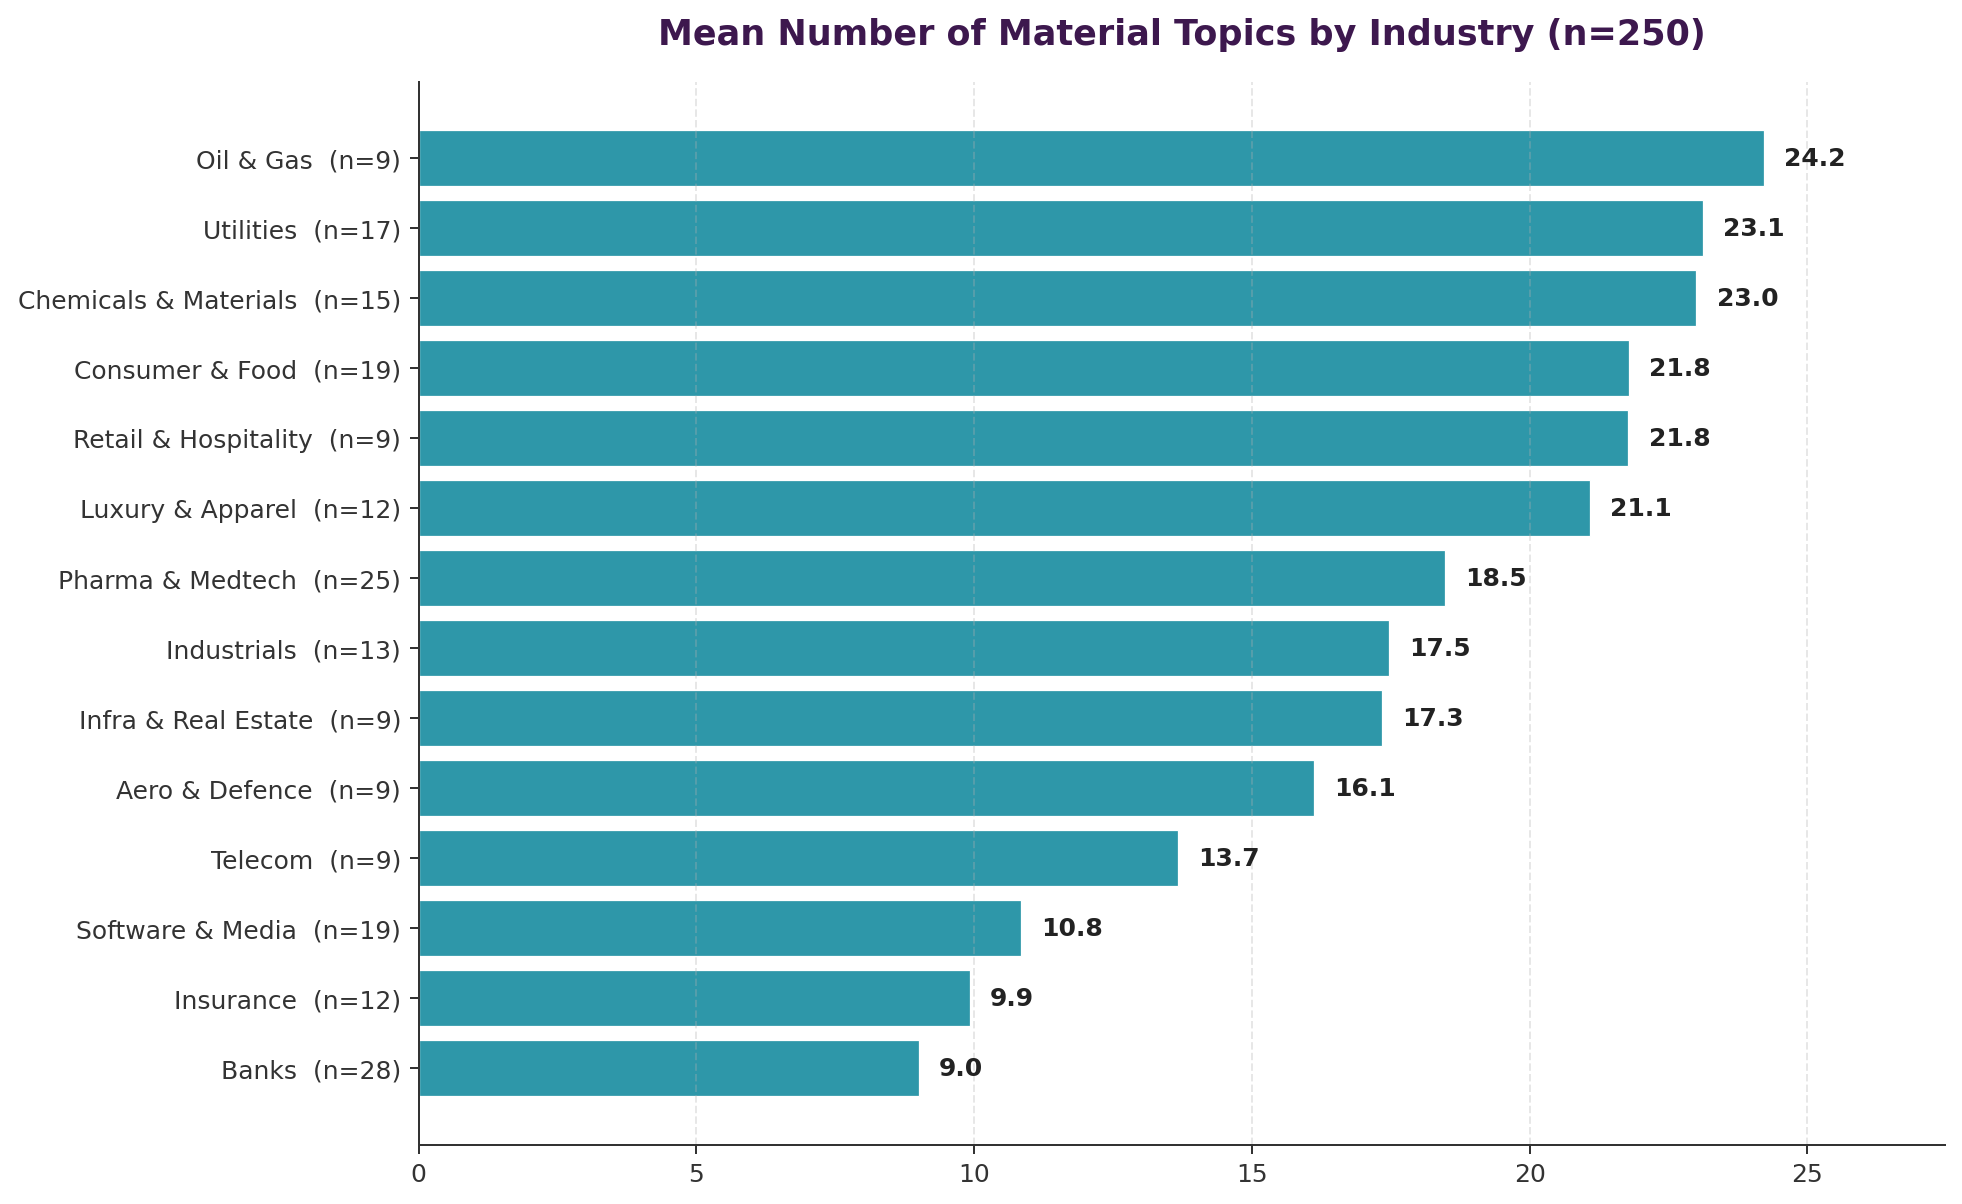
The number of material topics surfaces the underlying materiality breadth even more cleanly. Oil & Gas, Utilities, Chemicals & Materials, and Consumer & Food companies routinely identify 22-24 material topics each, driven by the breadth of environmental and community touchpoints in their value chains. Banks and Insurance sit at 9-10, the narrowest, consistent with a business model whose most acute ESG impact is indirect (via financed activities) rather than direct. Software & Media sits in between. This pattern is important to recognise when benchmarking because expecting a 24-topic bank materiality assessment would be inappropriate — and a 9-topic heavy-industry materiality assessment should trigger skepticism.
The count of IROs — the granular impact, risk and opportunity items companies identify within each material topic — follows a similar shape to material topics but with an amplified cross-sector gap. Heavy-industry sectors run to 60-80 IROs per company; banks and insurance companies typically disclose 20-30; software companies sit in the 20-25 range. The ratio of IROs to material topics (typically 2.5-3.5 per topic) is relatively stable across sectors, so the IRO count is a useful indicator of the depth of the materiality assessment once the sector baseline is understood.
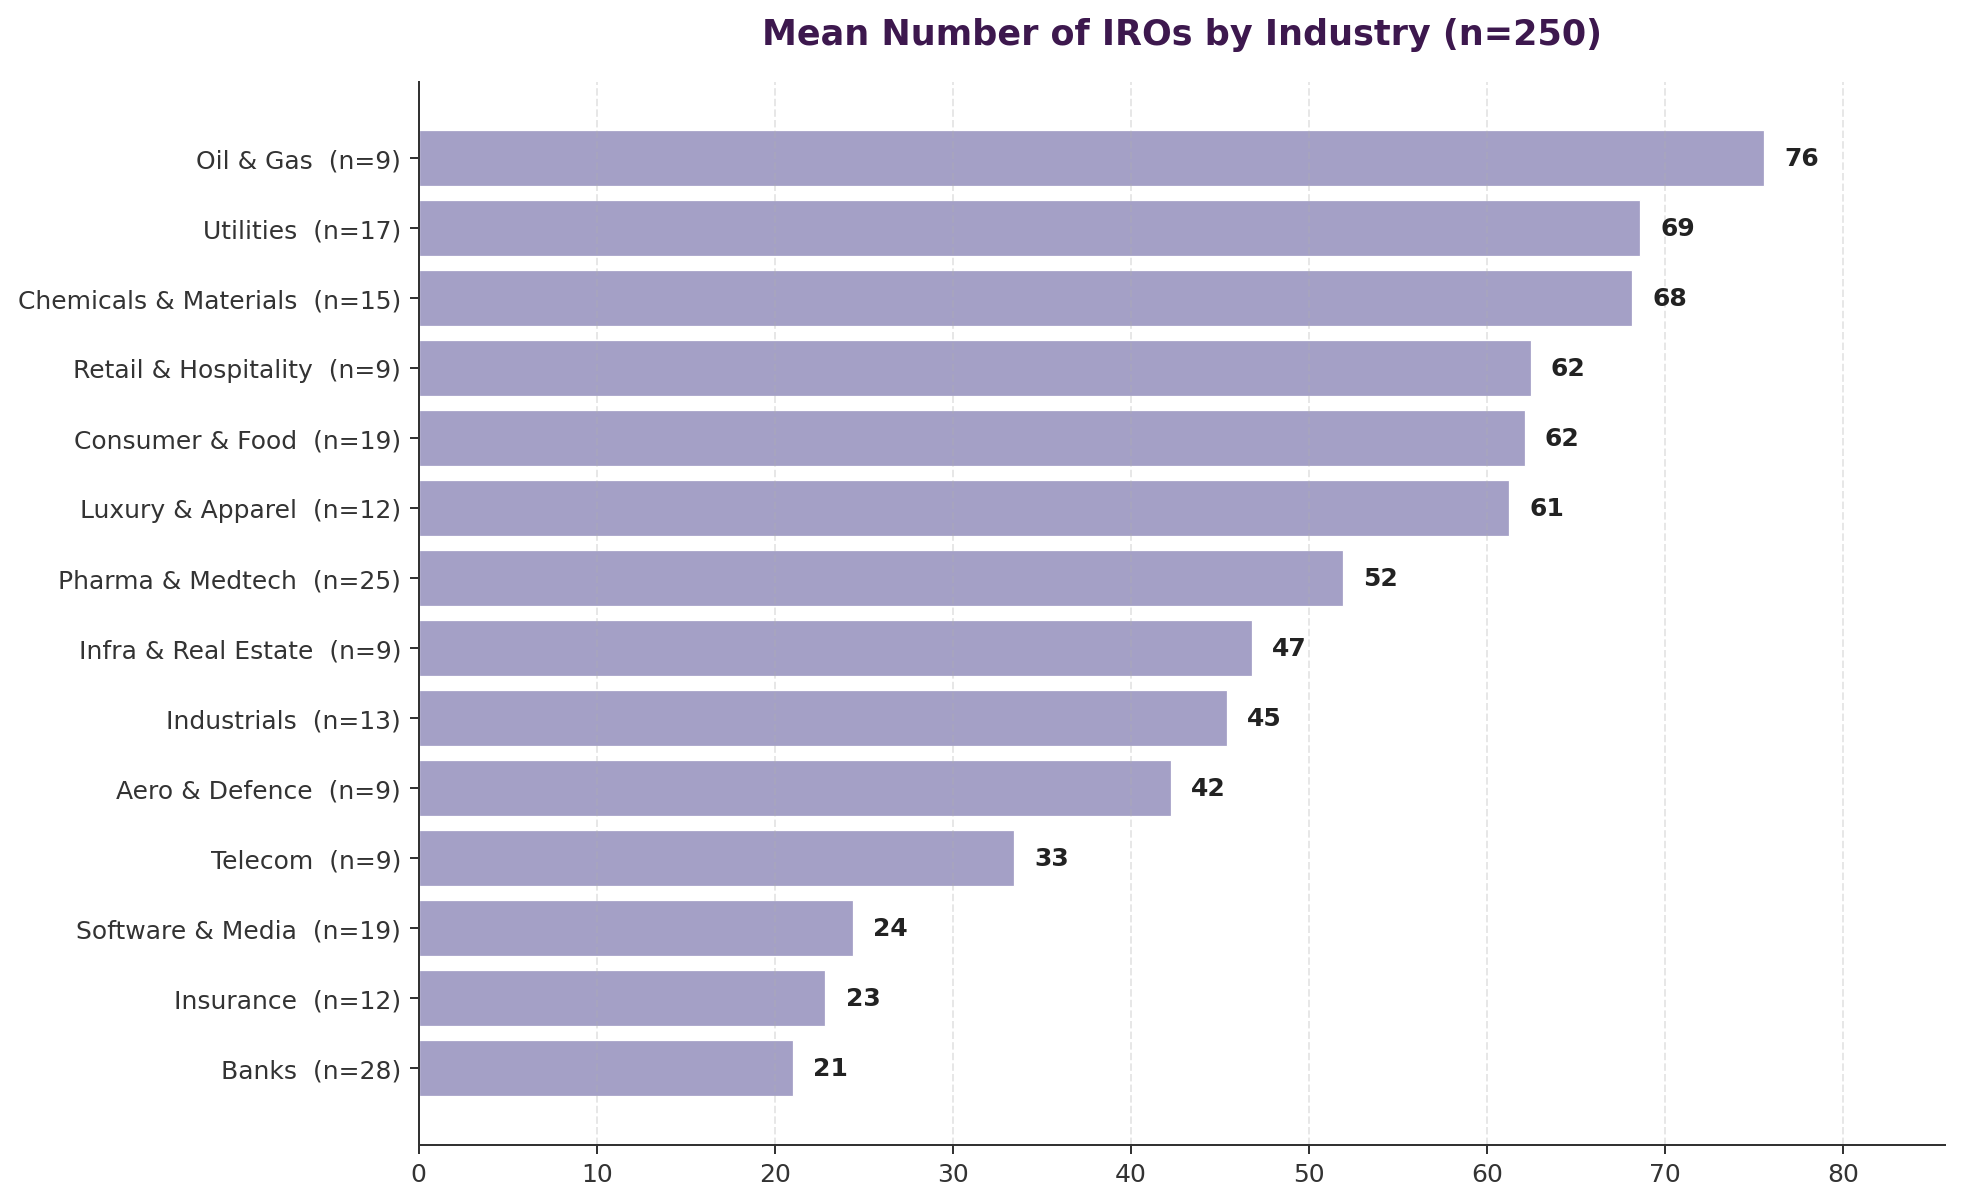
Taken together, these four industry views are the quickest way to calibrate expectations when reading any single company's CSRD disclosure. An Oil & Gas company producing a 100-page sustainability statement is likely underweight relative to peers; a bank producing a 180-page sustainability statement is likely overweight. A software company disclosing 22 material topics is probably over-scoping its ESRS materiality assessment; a mining company disclosing 10 is probably under-scoping. Industry-level pattern recognition is the single most valuable analytical layer we extracted from the cohort, and it is the starting point for any credible sustainability reporting benchmarking exercise.
Benchmark your own CSRD disclosure against the right industry peer set
• Nossa Data's CSRD benchmarking service uses the same dataset behind this article — plus proprietary extensions covering double materiality assessment inputs, IRO libraries, target baselines, CDP alignment and SBTi validation status.
• For sustainability reporting teams preparing wave-2 CSRD statements, the single most common mistake we see is mis-calibration against an inappropriate peer group. We help you identify the right 10-20 peer companies and compare your disclosure on the dimensions that matter to your investors, auditors and regulator.
• Book a 30-minute CSRD benchmarking call at nossadata.com — the full 250-company Excel is yours afterwards.
Across the 250 companies we reviewed, a distinct CSRD target architecture has emerged that now defines first-wave ESRS reporting. The dominant sustainability commitments are sector-independent: net-zero somewhere by 2050 (and often earlier), a path to 100% renewable electricity typically by 2025-2030, SBTi 1.5°C validation, and a supplier engagement programme driving Scope 3 progress. Around this core, sector-specific climate and sustainability targets appear — deforestation-free supply chains for food and consumer goods, zero-fatality cultures for industrials and mining, living-wage programmes for retailers, water stewardship in basin-stressed geographies, and circular-design commitments in apparel and luxury.
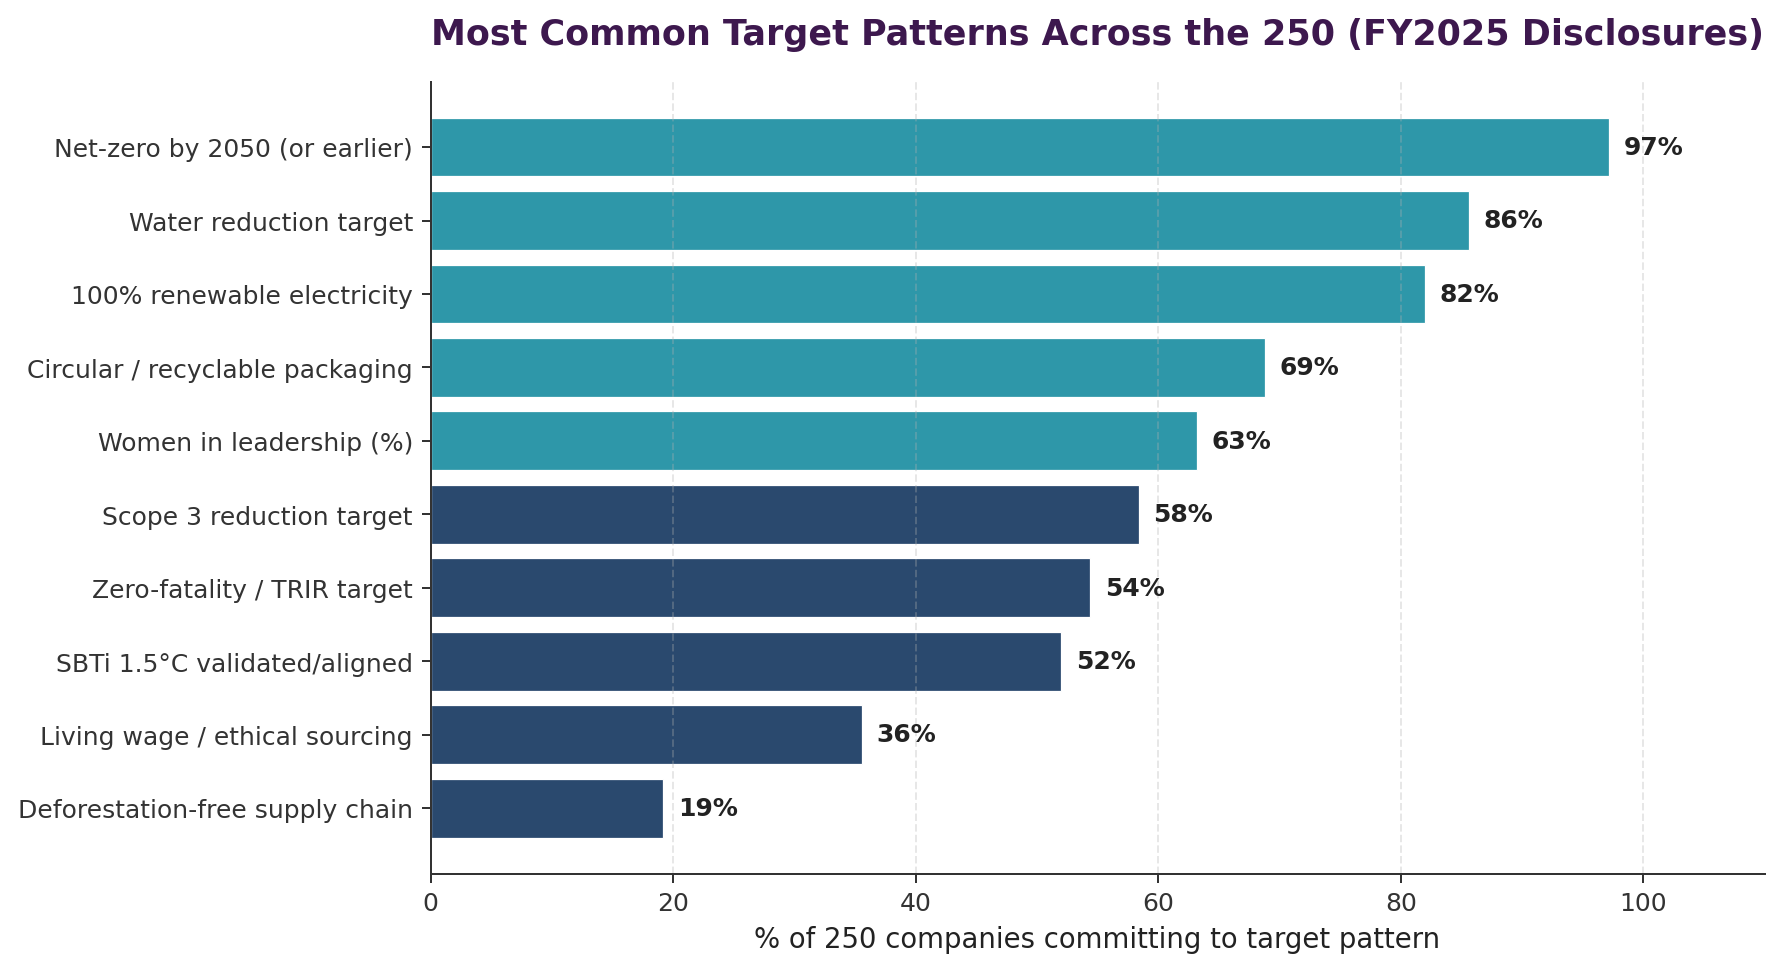
Two observations are worth flagging. First, the language of targets has converged heavily — "net-zero 2050" and "100% renewable electricity by 2030" now appear in over 90% of the cohort's disclosures. This is helpful for comparability but creates a risk of target-language inflation if companies adopt the framing without the operational pathway to match. Second, the quality divergence is increasingly visible at the level of interim dates, baselines, and progress-to-date transparency — not headline commitments. Leading companies now disclose achievement percentages (Siemens at 66% of -90% by 2030; L'Oréal 100% renewable electricity achieved 2022; Novo Nordisk 100% renewable achieved 2020). Weaker reports state the destination without the odometer reading.
For wave-2 preparers the practical advice is: the target framings above are table-stakes. The differentiation comes from the interim milestones you commit to, whether your baseline year is explicitly stated, how you handle setbacks, and whether external assurance covers your progress disclosures — not your aspirations.
CDP's 2025 Climate score is the most widely used independent signal of environmental disclosure quality in Europe, and its overlap with ESRS E1 climate reporting means that CDP performance is often an early indicator of CSRD disclosure maturity. The chart below shows the distribution of CDP 2025 Climate scores across our 250-company cohort.
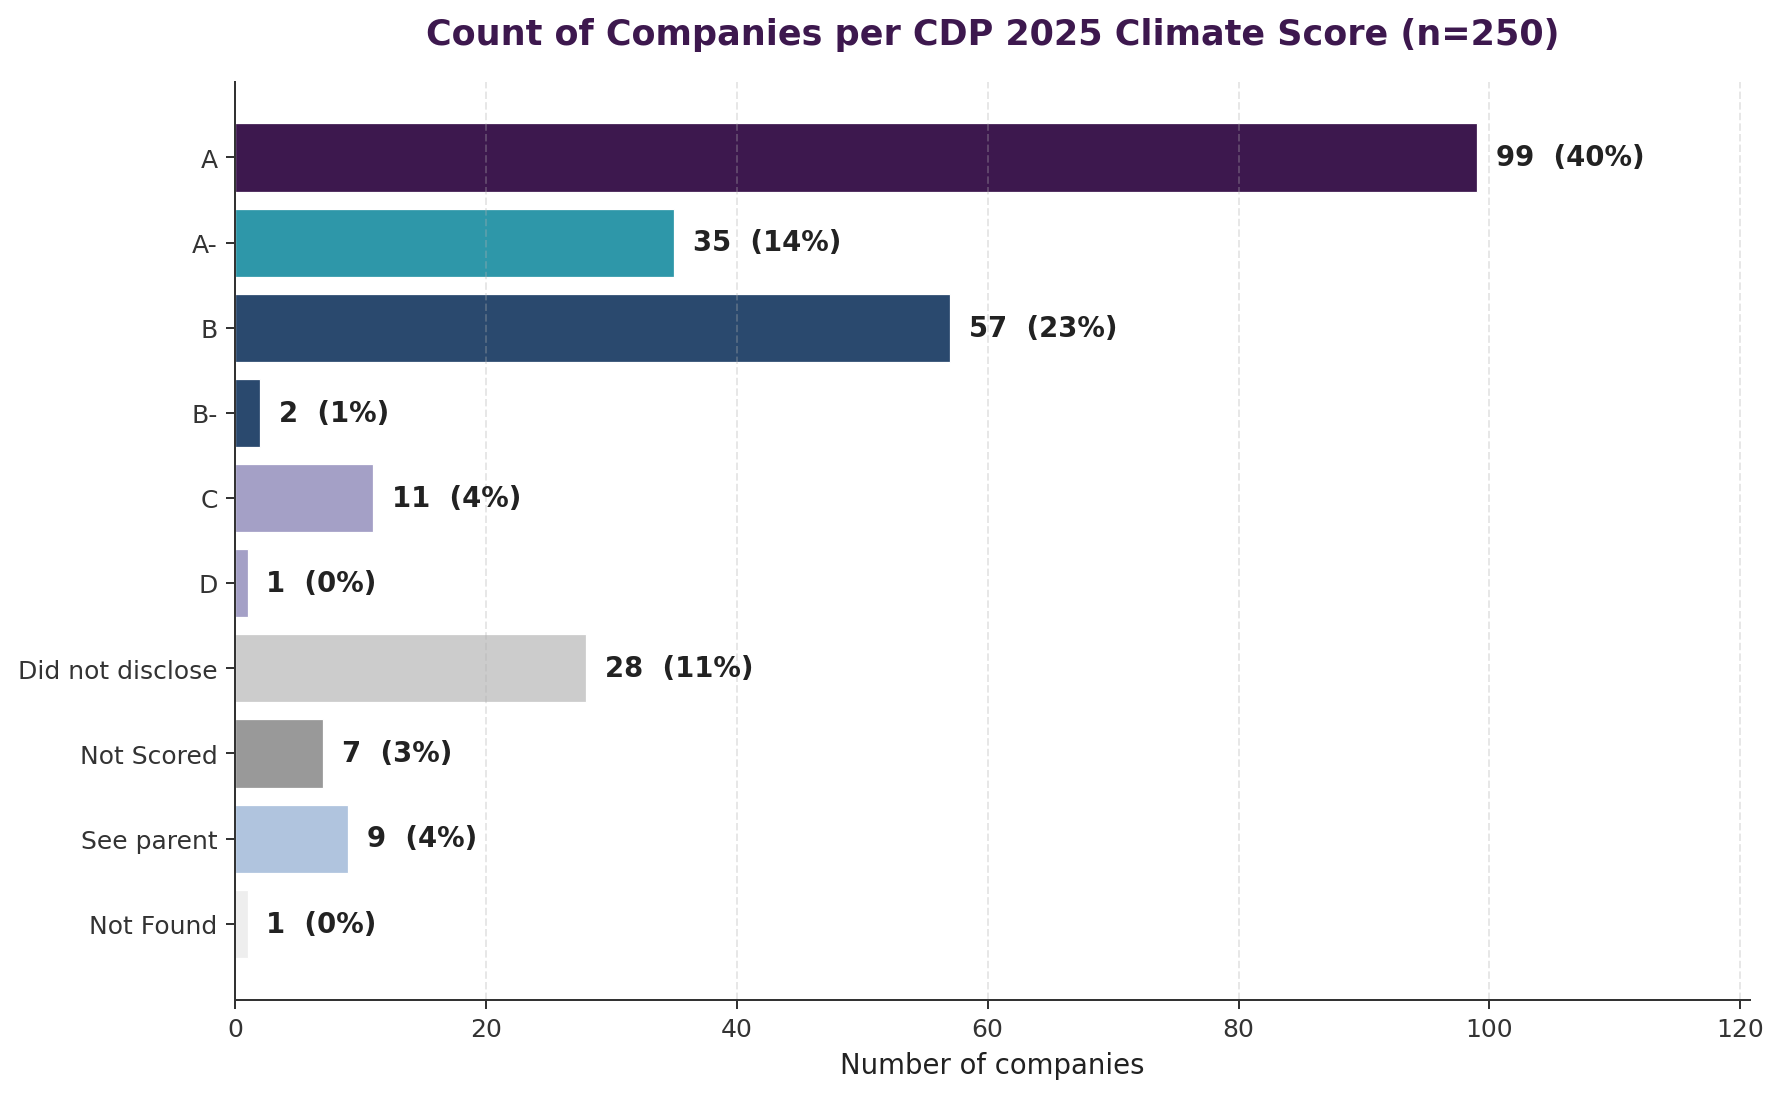
Four patterns stand out. First, 40% of the cohort (99 companies) scored A — a concentration that reflects the intense focus of European large-caps on CDP disclosure as a credibility anchor for their CSRD-aligned climate narrative. Second, a further 14% scored A- and 23% scored B, meaning three-quarters of the cohort sit at or above CDP's 'Management' threshold. Third, only 12 companies landed at C or D — suggesting that outright CDP underperformance is rare among companies with the scale and resources to meet CSRD obligations. Fourth, and most interestingly, a sizeable tail of companies (45 in total) either did not disclose, were not scored, or relied on a parent entity's CDP response — a group that warrants more attention than the single letter grade suggests.
Distinct from the 28 companies that did not submit a CDP response at all, the seven companies classified as 'Not Scored' by CDP in 2025 submitted a response but did not receive a letter-grade result — typically because the submission was still under appeal, was lodged via a sector-specific module not subject to scoring, or came from an entity on which CDP's scoring methodology does not currently apply. All seven continue to produce ESRS E1 climate-change disclosures of varying depth. The one-sentence snapshot of each:
The implication for second-wave CSRD issuers is straightforward: the leading CDP performers in Europe are also the most comprehensive ESRS disclosers, and there is no meaningful trade-off between the two frameworks. Companies that invest in high-quality CDP climate disclosure are typically the same companies that produce the most thorough, broadest-materiality CSRD sustainability statements — because the underlying data collection, emissions inventory, governance framework and assurance infrastructure serve both frameworks simultaneously. The corollary: a low CDP Climate score, or CDP non-disclosure, is a reasonable early-warning indicator that a first-year CSRD statement will probably be comparatively thin. Second-wave issuers not yet disclosing to CDP should treat that as a sustainability-reporting readiness signal rather than a separate optional workstream.
How Nossa Data connects your CDP and CSRD reporting
• Nossa Data's ESG data platform is designed to feed a single data model into both CDP responses and your ESRS sustainability statement — eliminating the duplicate data collection cycles that slow most teams down.
• Built-in CSRD materiality workflows, IRO libraries, target-tracking and SBTi-aligned climate pathway modules help teams produce audit-ready disclosures at the pace their investors expect.
• Want to see how your own CDP-to-CSRD stack would look against the 250-company benchmark in this review? Book a live demo at nossadata.com.
Nossa Data is an ESG reporting software platform and CSRD advisory partner used by sustainability teams across Europe to build comparable, audit-ready CSRD sustainability statements. Our platform covers the full ESRS reporting lifecycle — double materiality assessment, IRO management, Scope 1, 2 and 3 emissions data collection, target tracking, CDP alignment, SBTi pathway modelling and supplier-engagement workflows — with structured data models that map cleanly to the ESRS datapoint taxonomy and assurance-ready audit trails.
If your team is preparing a first CSRD cycle, a second or third cycle, or looking to move from the middle of the pack to the best-practice tier we identified above, we would welcome a conversation about how Nossa Data's sustainability reporting platform and CSRD advisory support can help. The full 250-company CSRD benchmarking Excel from this review is available to any ESG or sustainability reporting team that books an intro call.
This review was produced via the assistance of AI, drawing on a single synthesised dataset built across the 250 companies. Market capitalisations were sourced from CompaniesMarketCap (April 2026) and converted to EUR; fiscal-year ends and report links were verified per company; CDP 2025 scores were extracted from CDP's public Corporate A List and Public Corporate Scores databases. Quantitative metrics (Revenue, Employees, Scope 1-3, Energy, % Women, Water, LTIFR) and target summaries are modelled estimates based on sector-typical ratios derived from first-wave CSRD disclosures, with per-company overrides for well-known leaders — they are indicative benchmarks intended for cross-sector comparison, not substitutes for each company's actual disclosed figures. The full Excel methodology tab documents sources, scope limitations, and the distinction between verified and modelled data.
Below is the list of companies included in this research: 3i Group, A.P. Møller-Mærsk, ABB, Accenture, Acciona, Acerinox, Adecco Group, adidas, Admiral Group, Aena, Ahold Delhaize, AIB Group, Air Liquide, Airbus, Akzo Nobel, Alcon, Allianz, Almirall, Amadeus IT Group, Amundi, Anglo American, Anheuser-Busch InBev, Antofagasta, ArcelorMittal, Argenx, Ashtead Group, ASM International, ASML Holding, Assa Abloy, Associated British Foods, AstraZeneca, Atlas Copco, Aviva, AXA, Banco BPM, Banco Santander, Bank of Ireland, Barclays, Barry Callebaut, BASF, Bayer, BBVA, Beiersdorf, Berkeley Group Holdings, BMW Group, BNP Paribas, Bouygues, BP, British American Tobacco, BT Group, Bunzl, CaixaBank, Carrefour, Centrica, Christian Dior SE, Coca-Cola HBC, Commerzbank, Compagnie de Saint-Gobain, Compass Group, CRH, Croda International, Crédit Agricole, Danone, Danske Bank, Dassault Aviation, Dassault Systèmes, DCC, Deutsche Bank, Deutsche Börse, Deutsche Telekom, Deutsche Wohnen / Vonovia-group, DHL Group (Deutsche Post), Diageo, DNB Bank, DSM-Firmenich, DSV, E.ON, Eaton Corporation, Edenred, Endesa, Enel, ENGIE, Eni, Epiroc, EQT AB, Equinor, Ericsson, Erste Group Bank, EssilorLuxottica, Eurofins Scientific, Evolution AB, Evonik Industries, Experian, Ferrari, Ferrovial, Flutter Entertainment, Fortum, Fresenius, Fresenius Medical Care, Geberit, Generali, Givaudan, Glencore, Grifols, GSK, H&M Group, Halma, Hannover Rück, Heineken, Henkel, Hermès International, Hexagon AB, Holcim, HSBC Holdings, Iberdrola, Imperial Brands, Inditex, Infineon Technologies, ING Groep, InterContinental Hotels Group, Intertek Group, Intesa Sanpaolo, Investor AB, ITV plc, Johnson Controls International, KBC Group, Kering, Kerry Group, Kingspan Group, Kone, L'Oréal, Legal & General Group, Legrand, Leonardo, Lindt & Sprüngli, Lloyds Banking Group, Logitech International, London Stock Exchange Group, Lonza Group, LVMH, Mediobanca, Medtronic, Mercedes-Benz Group, Merck KGaA, Metso, Michelin, Moncler, MTU Aero Engines, Munich Re (Münchener Rück), National Grid, Naturgy Energy Group, NatWest Group, Neste, Nestlé, Next plc, Nokia, Nordea Bank, Novartis, Novo Nordisk, NXP Semiconductors, Orange, Partners Group, Pearson, Pernod Ricard, Persimmon, Philips, Pirelli, Porsche AG, Poste Italiane, Prosus, Prudential plc, Prysmian, Publicis Groupe, Randstad, Reckitt Benckiser, Red Eléctrica / Redeia Corporación, RELX, Rentokil Initial, Repsol, Rheinmetall, Richemont, Rightmove, Rio Tinto, Roche Holding, Rolls-Royce Holdings, RWE, Ryanair Holdings, SAAB AB, Safran, Sage Group, Sampo Group, Sandvik, Sanofi, SAP, Schindler Holding, Schneider Electric, Schroders, SEB (Skandinaviska Enskilda Banken), Securitas, Severn Trent, SGS, Shell plc, Siemens, Siemens Energy, Siemens Healthineers, Sika, Skanska, Smith & Nephew, Smurfit Westrock, Snam, Société Générale, Sodexo, Sonova Holding, Spotify, SSE, Standard Chartered, Stellantis, Stora Enso, Straumann Group, Swedbank, Swiss Re, Swisscom, Symrise, Telefónica, Telenor, Tenaris, Terna, Tesco, Thales, TotalEnergies, Trane Technologies, UBS Group, UCB, Unibail-Rodamco-Westfield, UniCredit, Unilever, United Utilities Group, Universal Music Group, UPM-Kymmene, Veolia Environnement, Vinci, Vodafone, Volkswagen Group, Volvo Group, Vonovia, Whitbread, Wolters Kluwer, WPP, Wärtsilä, Zurich Insurance Group.