
Interviews
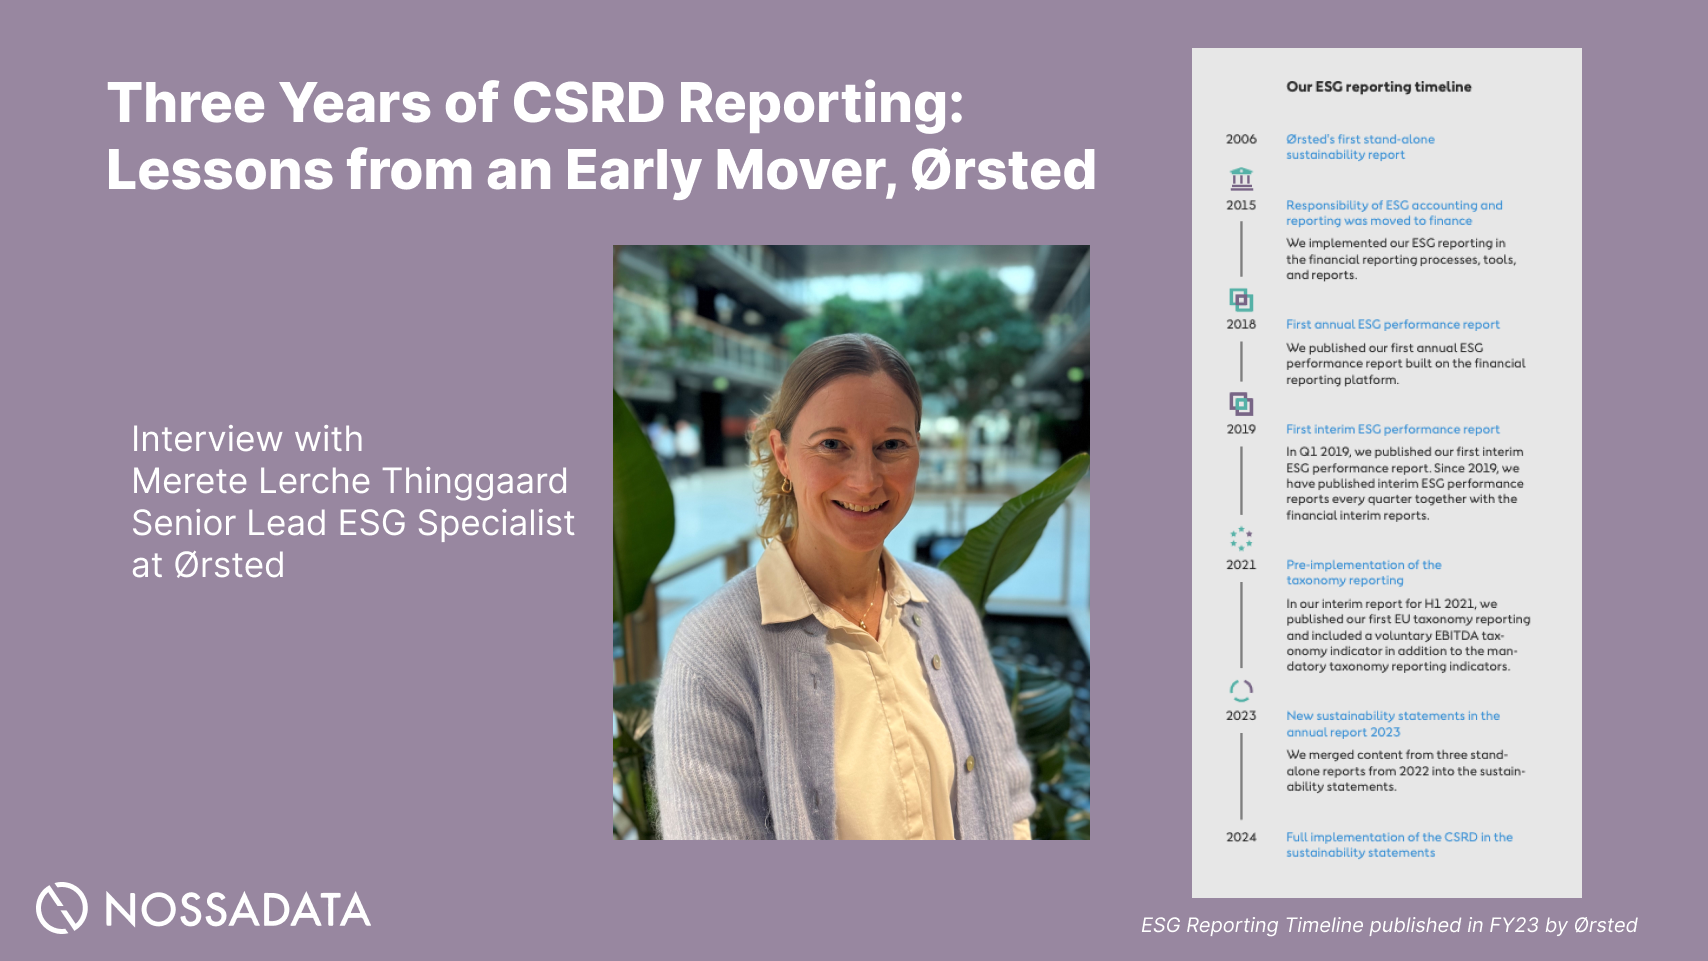
Three Years of CSRD Reporting: Lessons from an Early Mover, Ørsted
An expert interview with Merete Lerche Thinggaard, Senior Lead ESG Specialist at Ørsted, on three CSRD reporting cycles.
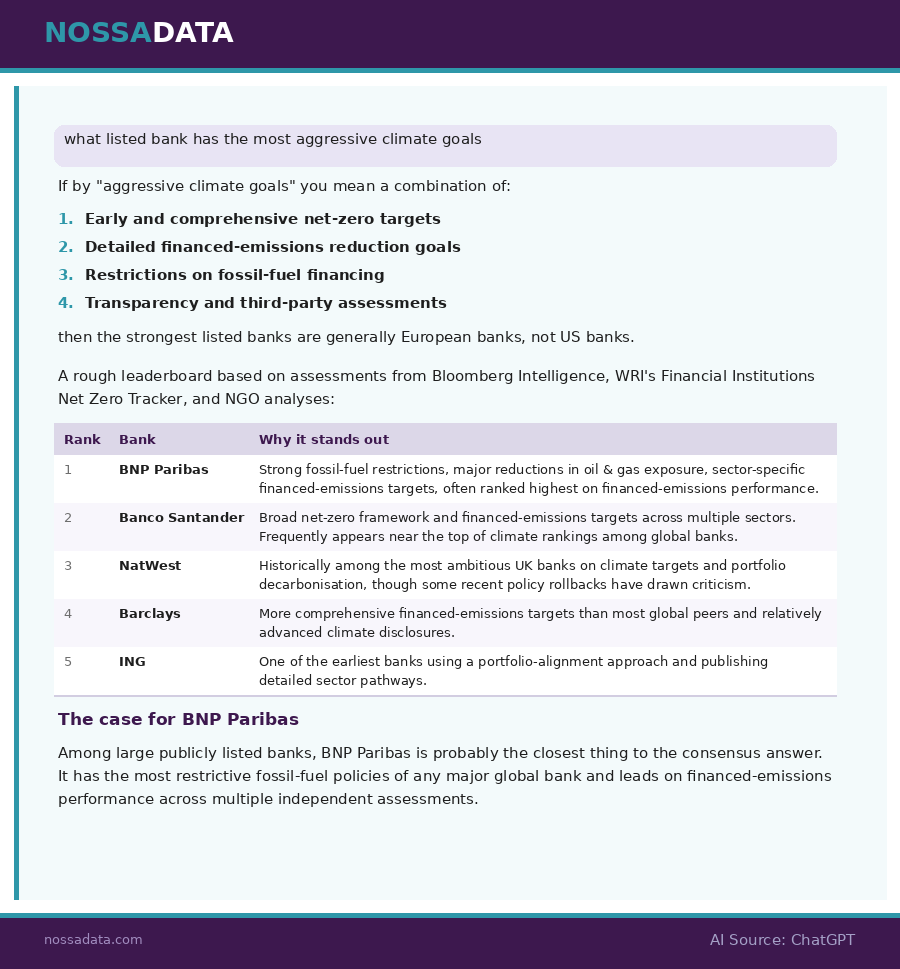
Banks: BNP has the most aggressive climate goals of listed banks (Chat GPT)
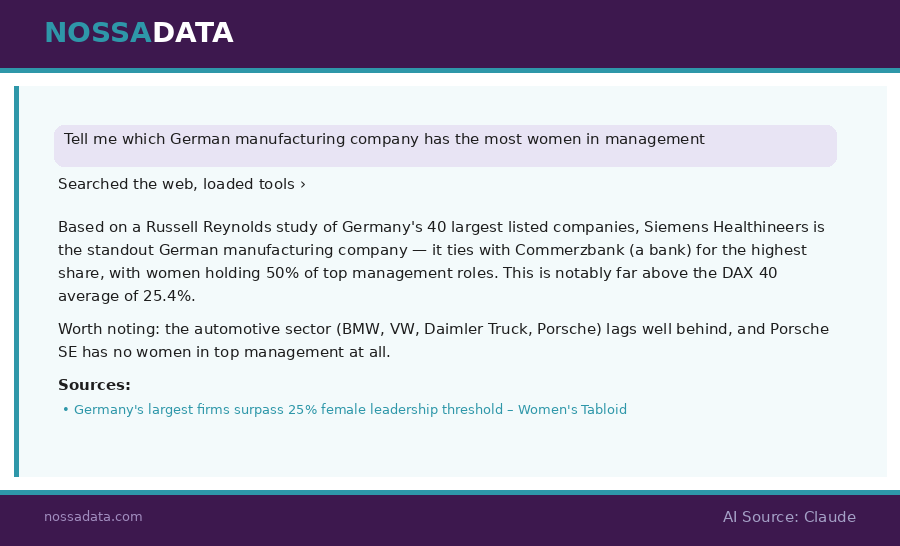
German Manufacturing: Siemens Healthineers has the highest share of women in top management against other German listed companies (Claude)
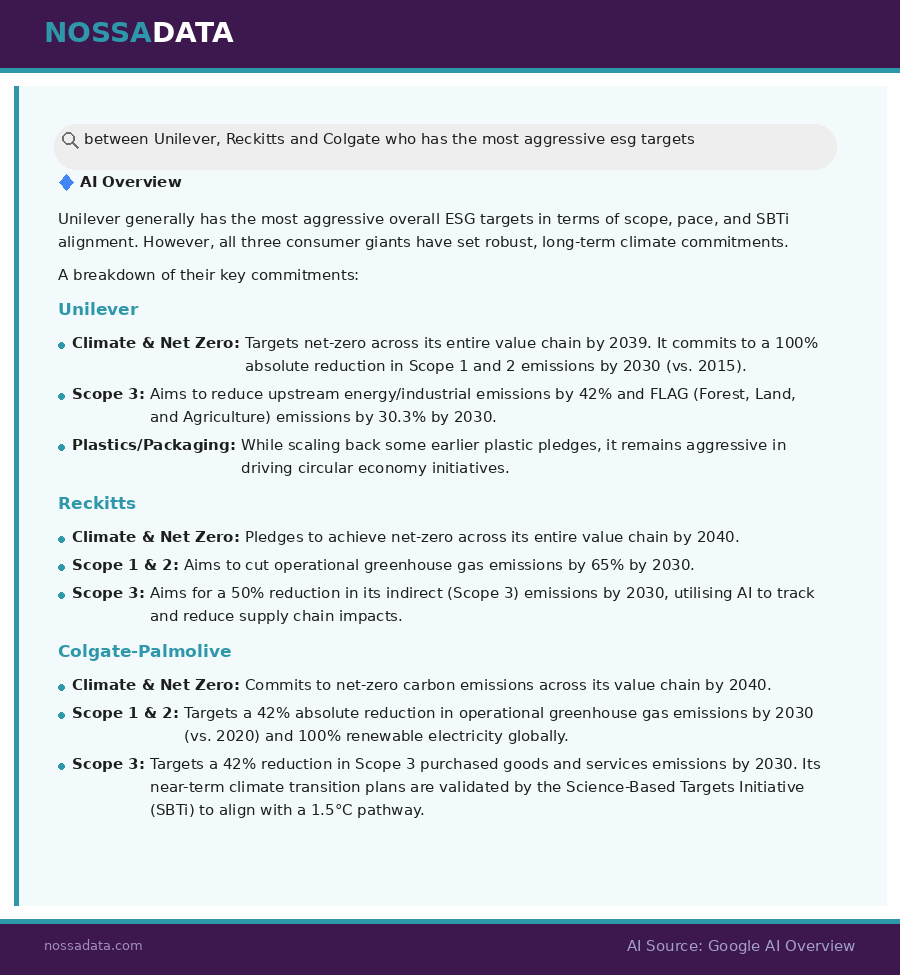
Consumer Goods: Unilever has the most aggressive ESG targets versus Reckitt and Colgate (Gemini)
I have not fact checked any of the above statements however ask an AI to rank a companies sustainability performance it will quickly provide you with an answer. While corporate disclosure has always had multiple audiences: regulators, investors, analysts, and increasingly the general public. A new audience has entered the room — one that reads every word you publish, synthesises it in seconds, and delivers its interpretation to millions of people who will never visit your IR website or read your Annual Report directly. That audience is AI.
Tools like Claude, ChatGPT, Google AI Overviews, and Copilot are now among the primary channels through which rating agencies, analysts, investors, journalists, and sustainability professionals research companies. When someone asks an AI tool 'what is Company X's carbon intensity?' or 'how does Company Y approach supply chain due diligence?', the AI will give an answer — and that answer will be sourced from whatever it can find and understand in your published materials.
The question is not whether AI will interpret your disclosure. It already is. The question is whether it will interpret it accurately, completely, and in a way that reflects your actual performance — or whether it will fill gaps with approximations, outdated data, or nothing at all.
This guide explains what makes corporate disclosure AI-friendly, why most annual reports and IR websites currently fail on this dimension, and the practical steps your team can take — starting with your next reporting cycle — to improve your visibility and accuracy in AI-generated search results.
Below I tested asking x3 AI tools to compare across regions and geographies.
Google AI Overview: Between Unilever, Reckitts and Colgate who has the most aggressive ESG target?
Chat GPT: What listed bank has the most aggressive climate goals?
Claude: Tell me which German manufacturing company has the most women in management?
The growth of AI:
Nossa Data's ESG reporting platform produces structured, framework-aligned ESG data outputs that are designed to be accurate, consistent, and citable — precisely the attributes that determine whether your disclosure is surfaced by AI search tools. Our advisory teams work with companies to not only streamline their reporting process but to make sure their data is found when it gets published.
To learn more, visit nossadata.com or request a demo to see how Nossa Data's output formats can improve your AI search visibility.
Why Your Corporate Disclosure Could be Invisible to AI
Before examining what good AI-friendly disclosure looks like, it is worth understanding where / how AI can have problems with existing pieces of corporate disclosure such as an Annual Report / Sustainability Statement and dynamic web content.
Annual reports often contain:
A simple extractor may read:
When the document should be read across both columns in a specific order. While visuals can be easy for humans to quickly interpret, putting key quantitative data inside a visual means that AI may struggle to interpret meaning.
A significant proportion of the data in corporate sustainability reports is presented in tables that are embedded as images — particularly in PDFs produced by design agencies. An image of a table containing your Scope 1, 2, and 3 emissions data is not data to an AI tool. It is a picture. The AI cannot read the numbers, cannot extract the metrics, and cannot cite them in response to a query about your emissions performance.
Can’t table images have text extracted via OCR (Optical Character Recognition)
While OCR can be used to turn images into machine readable text you are relying on an additional layer to make sure your corporate data is interpreted correctly. If you rely entirely on OCR you still may struggle to have your data extracted correctly leading to errors in the data sets used by investors and other stakeholders.
AI systems — particularly large language models — extract information most effectively from content that is clearly structured: distinct headings, labelled data points, short declarative sentences, and organised tables with clear column headers. Most narrative annual reports are written in flowing prose, with data embedded in paragraphs or buried in footnotes. This is appropriate for human readers but creates significant barriers for AI extraction.
Understanding how AI tools process and cite content helps you make targeted improvements. There are three primary factors that determine whether your disclosure gets cited:
Content must be technically accessible to AI crawlers. This means: clean HTML (or accessible, text-layer PDFs), no login barriers, publicly indexed pages, and content that does not rely on JavaScript rendering to be visible. What works well:
Structured Data: Clear rows, columns, and fields.
Semantic: Metric names have consistent definitions.
Linked: Values are connected to: Units, Time periods, Methodologies and Footnotes
Machine-readable: Not trapped in images or visual layouts.
Consistent: The same metric is reported the same way every year.
AI tools are trained to cite specific, verifiable facts. A sentence reading 'We have reduced our carbon emissions significantly over the past three years' will almost never be cited. A structured table showing 'Total Scope 1 emissions: 42,500 tCO2e (2024), 44,200 tCO2e (2023), 48,100 tCO2e (2022) — a reduction of 3.8%' will be cited frequently. The more specific, the more citable.
Related to sourcing: Be sure that your reports and PDF are hosted on URLs and do not automatically download. This means that the AI can provide an exact URL with a page reference. If a key document automatically downloads instead you decrease the chance information will be found.
Your investor relations website is often the primary destination for AI crawlers seeking corporate data. The following structural improvements will significantly improve AI readability.
Rather than distributing ESG data across multiple pages, PDFs, and press releases, create a single, dedicated, publicly indexed HTML page that serves as the canonical source for your ESG performance data. This page should be linked prominently from both your IR and Sustainability navigation menus, updated annually in line with your reporting cycle, and structured with clear section headers and data tables.
Schema markup is metadata embedded in your website's HTML that helps AI systems understand what your content is about. While there is no single schema type specifically for ESG data, several schema types are directly applicable to IR and sustainability content:
Any AI that is crawling your website for your relevant disclosure is likely looking at many hundreds if not thousands of other companies too. Information needs to be easy to find. Do not scatter information across dozens of unique pages, keep information in a single easy to find home. If for example, all your policies are on the same page the AI can determine that is a page to focus on.
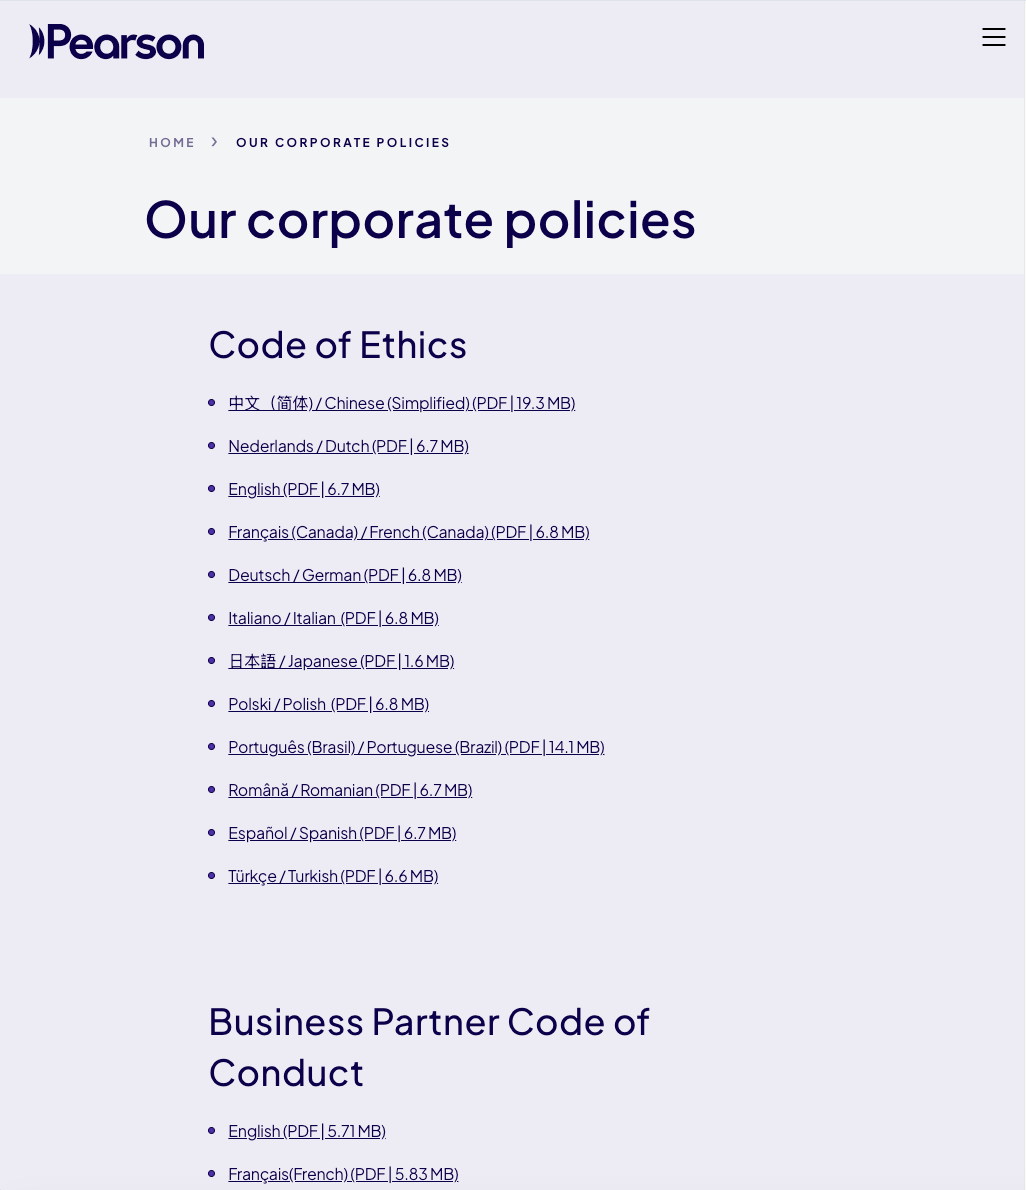
For example, consider the policy page by Pearson: https://plc.pearson.com/en-GB/corporate-policies
All of their policies are listed on a single page so it is easy for either an AI - or a human analyst - to find the information they need.
AI systems are particularly effective at surfacing content written in explicit question-and-answer format. Consider adding a 'Common ESG Questions' or 'ESG FAQs' section to your sustainability hub that directly answers questions like 'What are [Company]'s Scope 1 emissions?', 'What ESG frameworks does [Company] report against?', and 'What is [Company]'s net-zero target?'. These questions mirror the queries investors and analysts are putting to AI tools.
The structure of your sustainability statement and annual report determines how much of your disclosure AI can actually find, extract, and cite. This section provides concrete guidance — including example table formats — that your team can implement in your next reporting cycle.
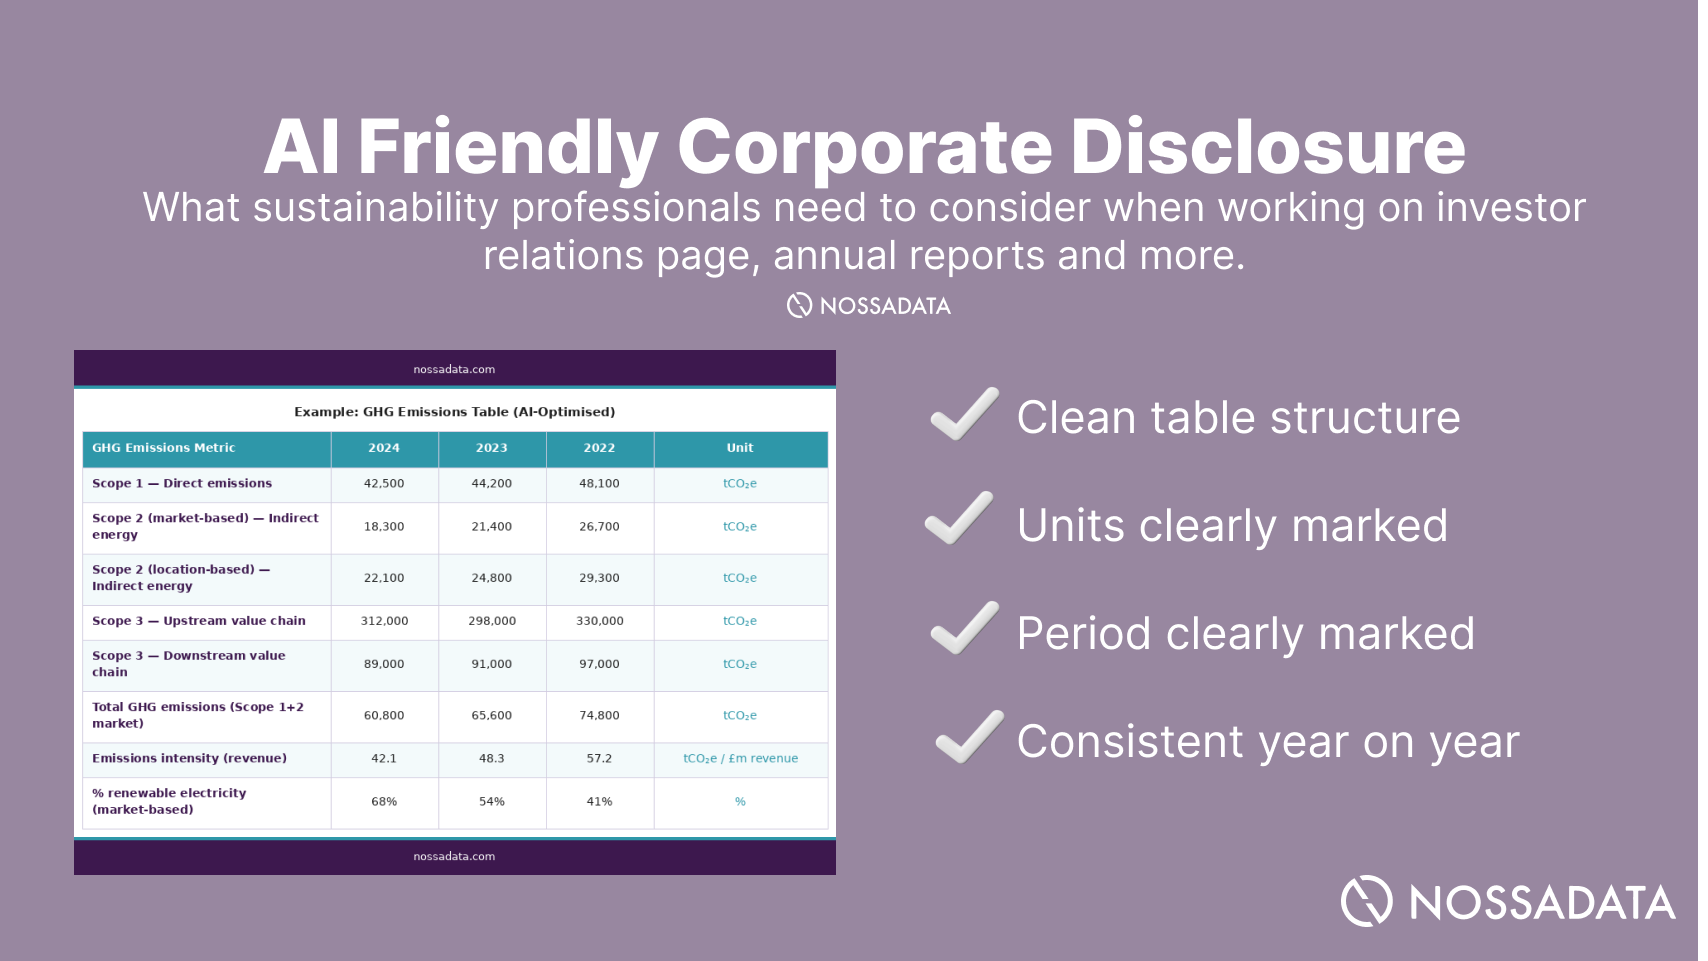
The most impactful single change you can make to your annual report structure is to ensure that quantitative data is presented in clean, labelled, text-based tables — not in designed infographics, not in images, and not in tables that are part of a scanned PDF. The following is an example of an AI-optimised GHG emissions table for your sustainability statement:
Example: GHG Emissions Table (AI-Optimised)
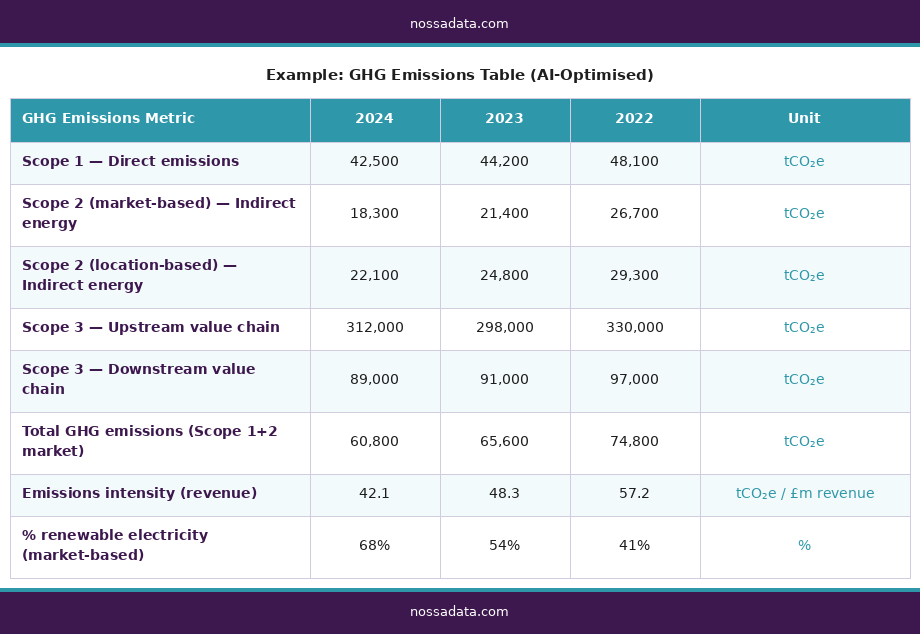
Above: Example of an AI-optimised GHG emissions table. Key features: explicit metric names in the left column, units in a dedicated column, three years of trend data, scope clearly identified. This structure allows AI tools to cite specific emissions figures accurately.
The same principle applies to your governance and social data. Below is an example of an AI-friendly board governance data table:
Example: Board Governance Data Table (AI-Optimised)
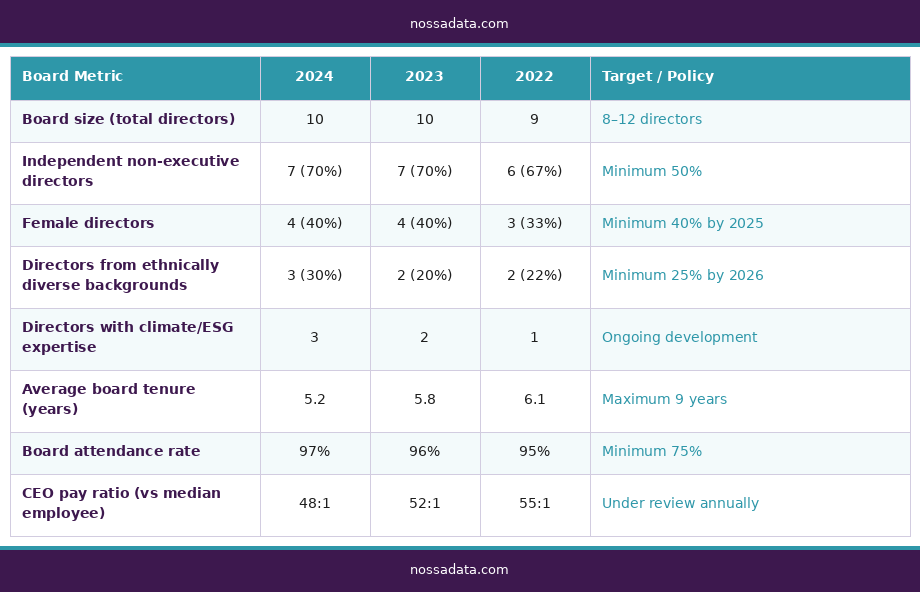
Above: Example of an AI-optimised board governance table. Policy or target columns give AI tools context to interpret whether a metric represents good performance — this is cited far more often than raw numbers alone.
For environmental data beyond GHG emissions, use the same structured approach for water, waste, and energy data:
Example: Water Data Table (AI-Optimised)
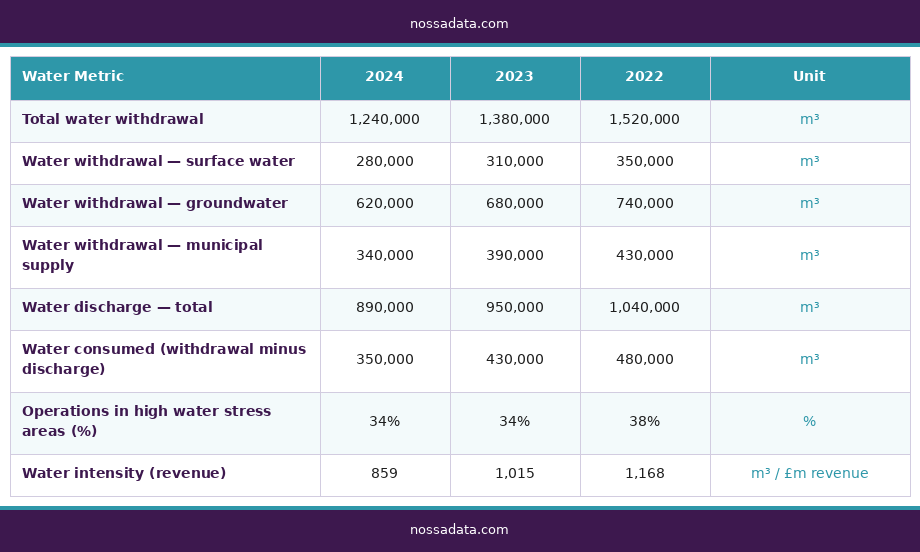
Above: Example of an AI-optimised water metrics table. Note the inclusion of both withdrawal and discharge figures — this matches the data points used by major ESG rating agencies including MSCI and Sustainalytics.
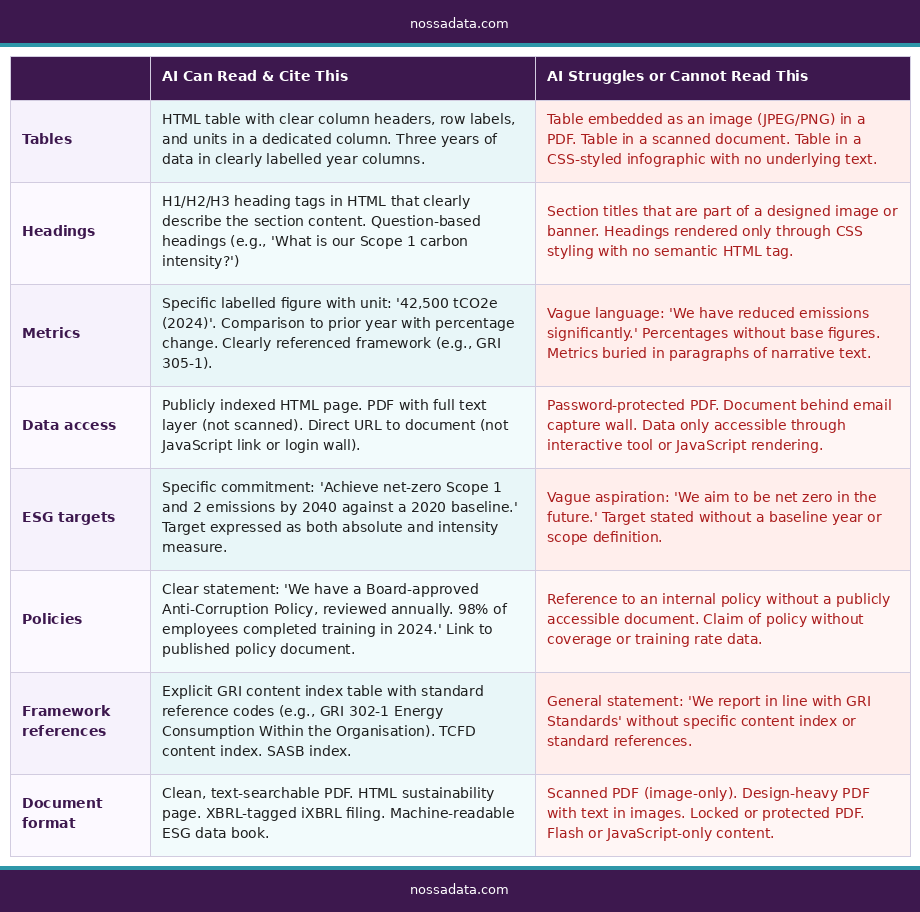
The following table summarises the specific formats and structures that AI tools can and cannot process effectively. Use it as a checklist when reviewing your next disclosure.
When structuring the ESG or sustainability section of your annual report, apply these principles to each major topic:
AI can transform sustainability benchmarking by automating the collection, extraction, and analysis of data required for frameworks such as CDP, S&P Global CSA or Ecovadis. Instead of manually reviewing hundreds of pages from your annual report, policies, and other disclosures, AI can identify relevant evidence, map responses to questionnaire requirements, flag data gaps, and benchmark performance against peers.
It can also monitor framework changes, track year-on-year progress, and improve consistency across submissions. By reducing manual effort and increasing accuracy, AI enables sustainability teams to focus on strategy and performance improvement while accelerating completion of increasingly complex benchmark and rating processes.
Can I use an out the box model for sustainability benchmarks? While out the box models like Open AI or Claude you can experiment with to help with ESG benchmarks, you have a risk of the model hallucinating about your data and creating extra works. Tech companies like Nossa Data train the models considering requirements of corporate sustainability teams as well as unique methodology rules of assessments such as CDP, MSCI or Ecovadis.
Data being found != You met the rating agency methodology
On top of finding your data most rating agencies also have specific methodology rules about what type of data they will accept when performing your assessment. While AI accessibility helps more of your data being found overall leading to less data corrections, it does not mean you will automatically meet the methodology criteria. Issuers should pair their disclosure strategy with AI readability with expertise in agency methodologies to ensure the best possible results on their annual disclosure assessments
Beyond the structure of your narrative report, there are specific technical formats that are most effective for ensuring ESG data is machine-readable by AI systems and ESG data aggregators alike.
XBRL (eXtensible Business Reporting Language) is the structured data format used for financial reporting in many jurisdictions, and it is increasingly being adopted for sustainability reporting under CSRD and ISSB. XBRL-tagged data is among the most AI-readable format available for corporate reporting. Where you are required to produce iXBRL-tagged disclosures under CSRD, ensure the tagging is complete and accurate — this data will be directly accessible to AI aggregators and rating agency data feeds.
A growing number of companies publish a standalone 'ESG Data Book' — a document or web page that presents raw ESG metrics separate from the narrative sustainability report (see our separate article on ESG data books). This is one of the most effective ways to improve AI readability: a clean, structured data reference document that AI tools can cite directly, without having to navigate narrative prose.
Beware of an ESG Data Book Excel: While many companies have taken to publishing their ESG data book via Excel this can be a challenge for citations by AI and rating agencies. As rating agencies are required to provide source content because Excel’s cannot be hosted on websites like a PDF can this can be a difficult document to use. Nossa Data recommends a PDF with a simple structure over Excel.
Nossa Data's ESG reporting platform produces structured, framework-aligned ESG data outputs that are designed to be accurate, consistent, and citable — precisely the attributes that determine whether your disclosure is surfaced by AI search tools. Our advisory teams work with companies to not only streamline their reporting process but to make sure their data is found when it gets published.
To learn more, visit nossadata.com or request a demo to see how Nossa Data's output formats can improve your AI search visibility.